 Global| Jan 10 2005
A Big Merchandise Trade Deficit for Taiwan in December and a Reduced Surplus for the Year
Summary
Taiwan's deficit on merchandise trade rose to $1,326.1 million in December from $237.6 in November. These were the first two deficits since June of this year and December's deficit was the largest recorded in the period from January [...]
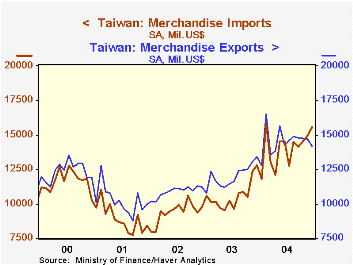
Taiwan's deficit on merchandise trade rose to $1,326.1 million in December from $237.6 in November. These were the first two deficits since June of this year and December's deficit was the largest recorded in the period from January 1978 to date. For the year as a whole, the balance on merchandise trade declined from a surplus of $16,933.3 million in 2003 to $6,257.2 million.
Exports peaked in February at $16,530 million and have trended down since then. Even so, exports for the year were up 20.9%. In December, exports to Asia declined 2.0% and to the U. S, 4.3%. The stronger Euro may have accounted for part of the 3.0% increase in exports to Europe in December
Although the trend in imports of merchandise has been more erratic than that of exports, it has recently become the more robust. Much of the rise is probably due to the increase in the cost of imported oil. The 4% rise in total imports in December was largely the result of a 52.0% rise in imports, mostly oil, from the Middle East.
Trade in Taiwan may be affected by the after effects of the recent tsunami disaster. Exports to the affected areas might be boosted while imports from those areas may decline. While some 60% of Taiwan's total trade (imports plus exports), is with Asia, most of this trade is with Japan, China and Hong Kong. In 2004, total trade with India, Indonesia, and Thailand, amounted to 4.1% of Taiwan's trade. (Data for Sri Lanka are not available). Exports were 3.5% of total exports and imports were 4.6% of total imports.
| Taiwan * | Dec 04 | Nov 04 | Dec 03 | M/M % | Y/Y % | 2004 Y/Y% | 2003 Y/Y% | 2002 Y/Y% | 2001 Y/Y% |
|---|---|---|---|---|---|---|---|---|---|
| Exports | 14,205.4 | 14,679.4 | 14,717.4 | -3.2 | 5.9 | 20.9 | 10.4 | 6.3 | -17.6 |
| To Asia | 8,771.4 | 8,953.4 | 8,184.8 | -2.0 | 7.17 | 26.7 | 15.32 | 15.2 | -15.9 |
| To US | 2,437.2 | 2,487.0 | 2,341.5 | -4.3 | 22.2 | 32.3 | 14.3 | 7.2 | -12.3 |
| To Europe | 1,918.0 | 1,862.0 | 1,905.0 | 3.0 | 0.7 | 14.9 | 10.2 | -6.3 | -16.5 |
| Imports | 15,532.0 | 14,937.0 | 12,826.1 | 4.0 | 21.1 | 32.2 | 13.1 | .94 | -23.4 |
| From Asia | 8,594.5 | 8,943.8 | 7,190.8 | -4.41 | 18.9 | 32.3 | 15.7 | 9.3 | -25.3 |
| From US | 2,063.4 | 1,820.5 | 1,835.2 | 13.3 | 12.5 | 29.1 | -7.0 | -27.5 | 27.6 |
| From Europe | 1,964.5 | 1,905.1 | 1,835.0 | 3.1 | 25.2 | 31.8 | 10.9 | -2.3 | -21.2 |
| From Middle East | 1,544.2 | 1,016.1 | 1,569.4 | 52.0 | 36.0 | 35.2 | 43.7 | 9.8 | -1.3 |
| M/M Dif | Y/Y Dif | Y/Y Dif | Y/Y Dif | Y/Y Dif | Y/Y Dif | ||||
| Balance | -1,326.1 | -2,376 | 588.6 | -1,069.0 | -1,915.7 | -10,676.1 | -1,33.1 | 2,437.4 | 7,319.0 |
More Economy in Brief


