Weak Aircraft Orders Pushed Down U.S. Durable Goods Orders in October
by:Sandy Batten
|in:Economy in Brief
Summary
- New orders for durable goods slumped 2.2% m/m in October following increases in both August and September
- A 24% monthly drop in aircraft orders drove the overall decline
- Orders excluding aircraft rose 0.2% m/m in October
- Core capital goods shipments and orders continued to rise in October with small upward revisions to September
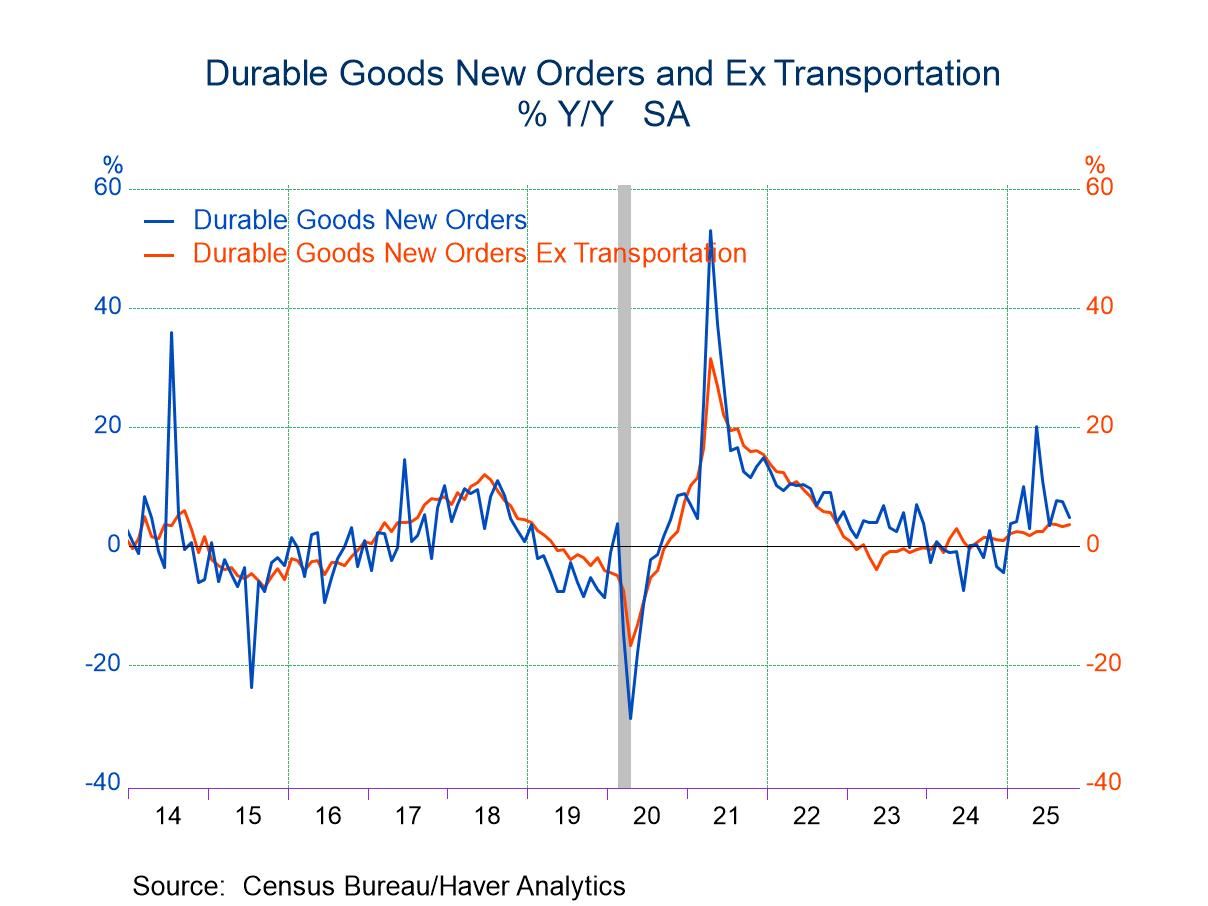
New orders for durable goods fell a more-than-expected 2.2% (+4.8% y/y) in October following an upwardly revised 0.7% m/m rise in September (previously +0.5% m/m) and a 3.0% monthly jump in August. The Action Economics Forecast Survey expected a 1.5% m/m decline. A 23.7% m/m drop in aircraft orders more than accounted for the overall decline. Orders excluding aircraft increased 0.2% m/m (4.0% y/y) in October on top of a 0.5% monthly increase in September.
More generally, transportation orders fell 6.5% m/m (+7.3% y/y) in October following a 0.6% m/m increase in September and an 8.0% monthly jump in August. In addition to the drop in aircraft orders, orders for motor vehicles and parts edged up 0.1% m/m in October, their sixth consecutive monthly increase. Across other sectors, orders for primary metals fell 0.7% m/m, their first monthly decline in ten months. Orders for electrical equipment and appliances slumped 1.5% m/m, their first monthly decline in seven months. In contrast, orders for fabricated metal products rose 0.5% m/m, their fourth consecutive monthly gain. Machinery orders increased 0.8% m/m, their eighth consecutive monthly rise. Orders for computers and electronic products increased a solid 1.0% m/m on top of a 1.2% monthly increase in September.
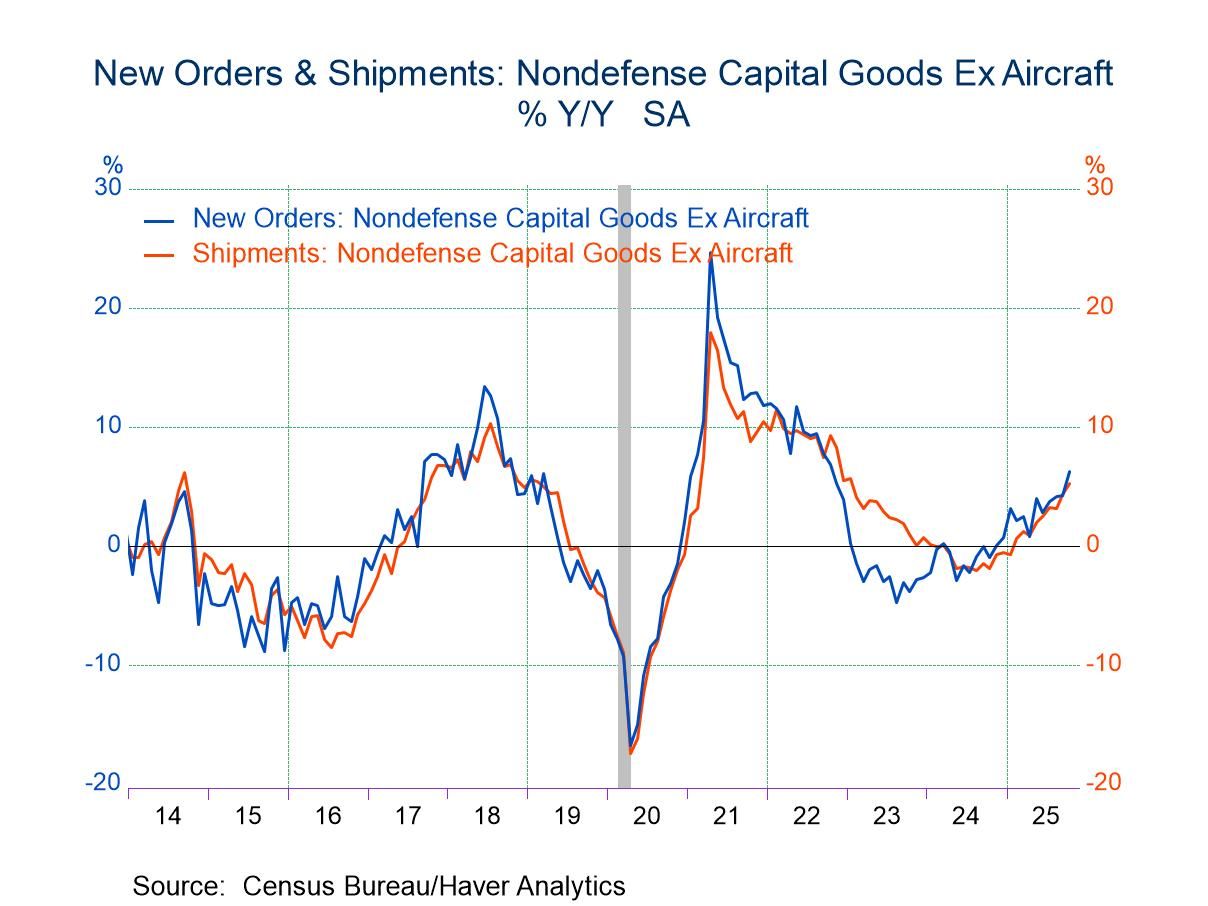
Shipments of core capital goods (nondefense capital goods shipments excluding aircraft) are a reliable coincident indicator of business spending on equipment in the national accounts. They rose 0.7% m/m in October following an upwardly revised 1.2% monthly gain in September (previously +0.9%). That was the second consecutive monthly increase and the fifth in the past six months. The strong end to Q3 and the continued rise in the first month of Q4 provides a solid starting point for all of Q4. The October shipments figure was 5.9% at an annual rate above the Q3 average. Core capital goods orders rose 0.5% m/m in October on top of an upwardly revised 1.1% m/m increase in September (previously +0.9%). This was the fourth consecutive monthly rise.
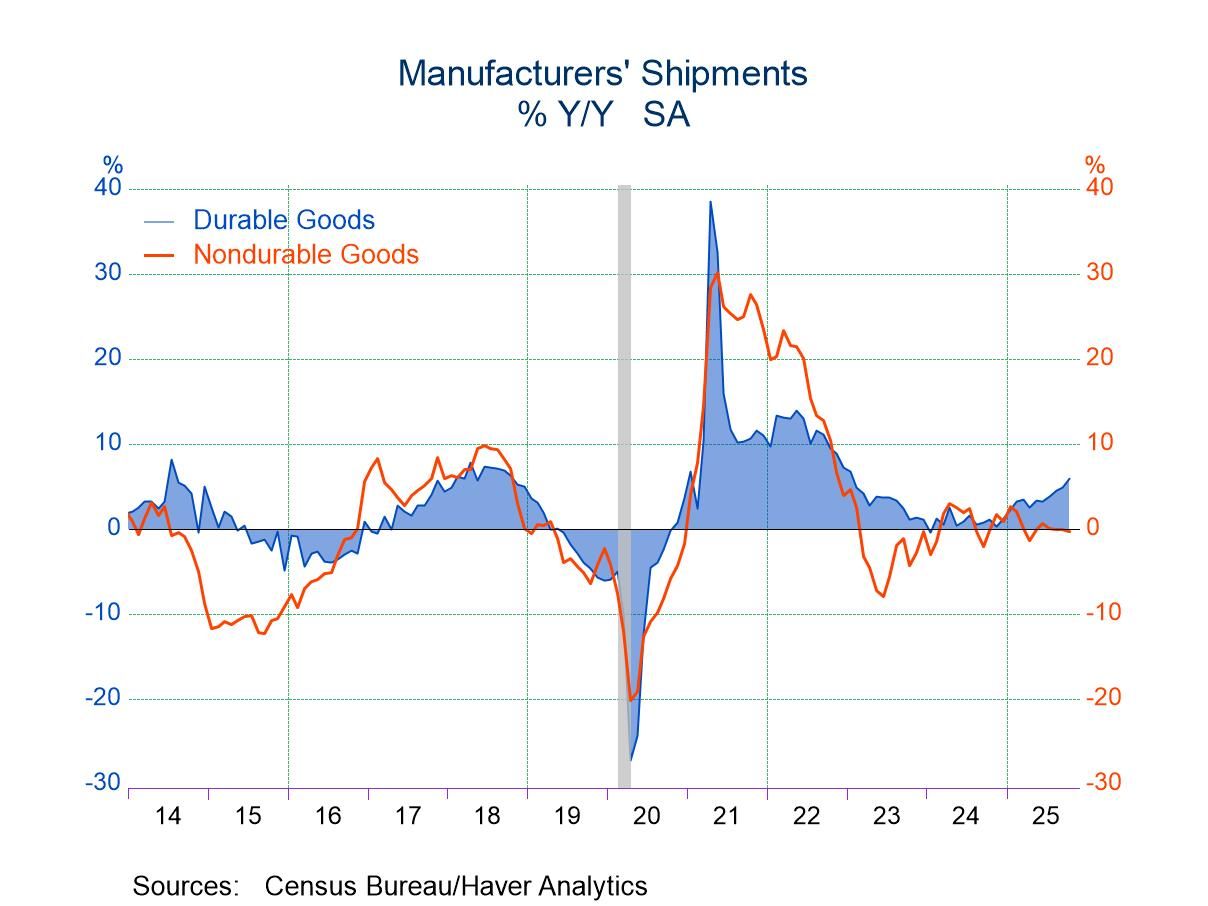
Total manufacturing shipments edged up 0.1% m/m (+2.8% y/y) in October after having been essentially unchanged in September. Shipments of durable goods increased 0.6% m/m (5.9% y/y), led by 1.4% monthly jump in transportation shipments. However, apart from a 0.1% m/m decline in shipments of other durable goods, all of the other major sectors posted monthly gains in October. In contrast, shipments of nondurable goods fell 0.4% m/m (-0.3% y/y) in October for their third consecutive monthly decline. The monthly decline was led by a 2.4% m/m fall in shipments of petroleum and coal products although it was relatively widely spread across major sectors. The one exception was a 2.1% m/m increase in leather product shipments, but this came after four consecutive sizeable monthly declines.
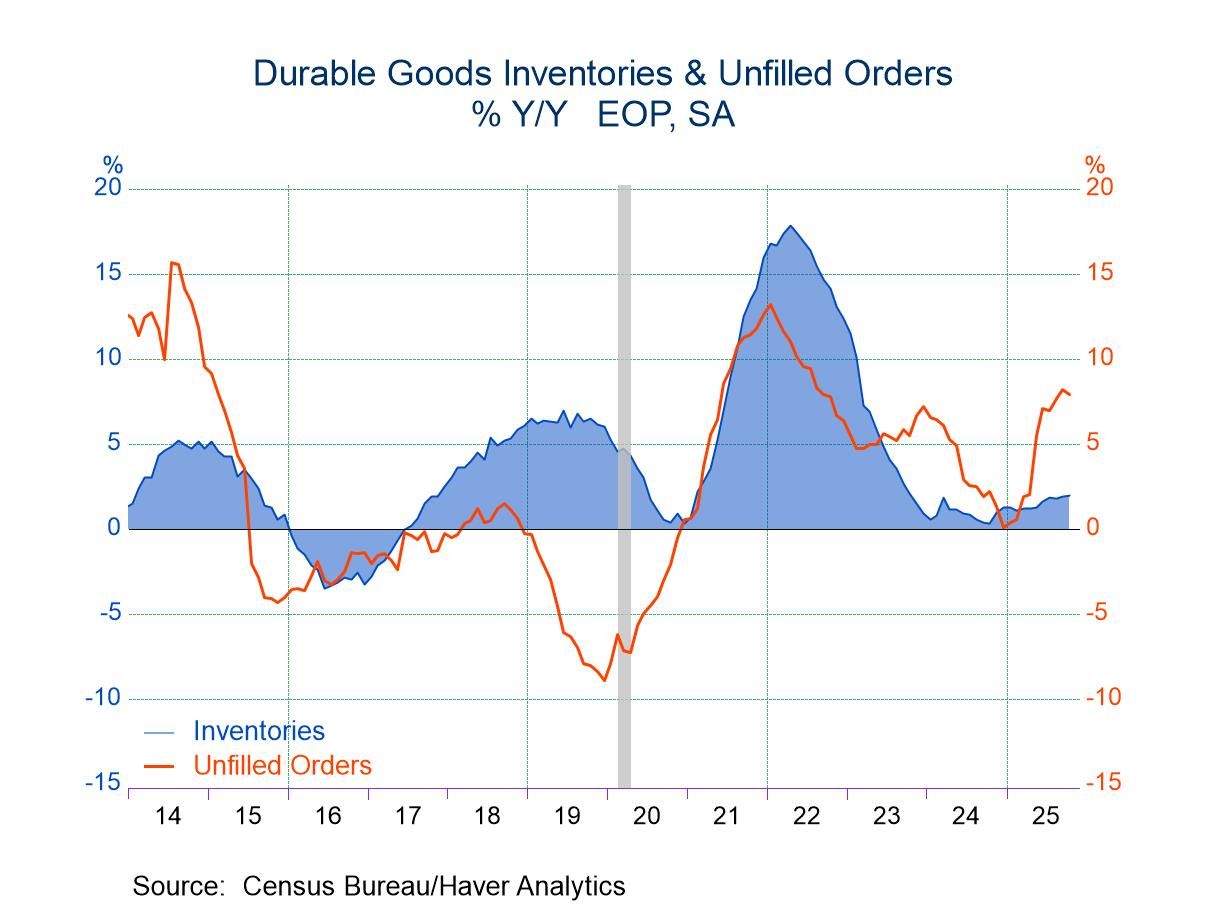
Unfilled durable goods orders increased 0.2% m/m (7.9% y/y) in October for their third consecutive monthly gain following a 0.8% m/m rise in September and a 0.7% m/m increase in August. Total factory inventories were unchanged in October (+1.4% y/y) following 0.1% monthly declines in both August and September. Durable goods inventories edged up 0.1% m/m in October while inventories of nondurable goods fell 0.2% m/m, the third consecutive monthly decline.
The factory sector data are available in Haver’s USECON database. The Action Economics Forecast Survey is in the AS1REPNA database.

Sandy Batten
AuthorMore in Author Profile »Sandy Batten has more than 30 years of experience analyzing industrial economies and financial markets and a wide range of experience across the financial services sector, government, and academia. Before joining Haver Analytics, Sandy was a Vice President and Senior Economist at Citibank; Senior Credit Market Analyst at CDC Investment Management, Managing Director at Bear Stearns, and Executive Director at JPMorgan. In 2008, Sandy was named the most accurate US forecaster by the National Association for Business Economics. He is a member of the New York Forecasters Club, NABE, and the American Economic Association. Prior to his time in the financial services sector, Sandy was a Research Officer at the Federal Reserve Bank of St. Louis, Senior Staff Economist on the President’s Council of Economic Advisors, Deputy Assistant Secretary for Economic Policy at the US Treasury, and Economist at the International Monetary Fund. Sandy has taught economics at St. Louis University, Denison University, and Muskingun College. He has published numerous peer-reviewed articles in a wide range of academic publications. He has a B.A. in economics from the University of Richmond and a M.A. and Ph.D. in economics from The Ohio State University.
More Economy in Brief

 Global

