U.S. Trade Deficit Widened in July
by:Sandy Batten
|in:Economy in Brief
Summary
- The trade deficit widened to $78.3 billion in July from $59.1 billion in June.
- This was the largest deficit since March.
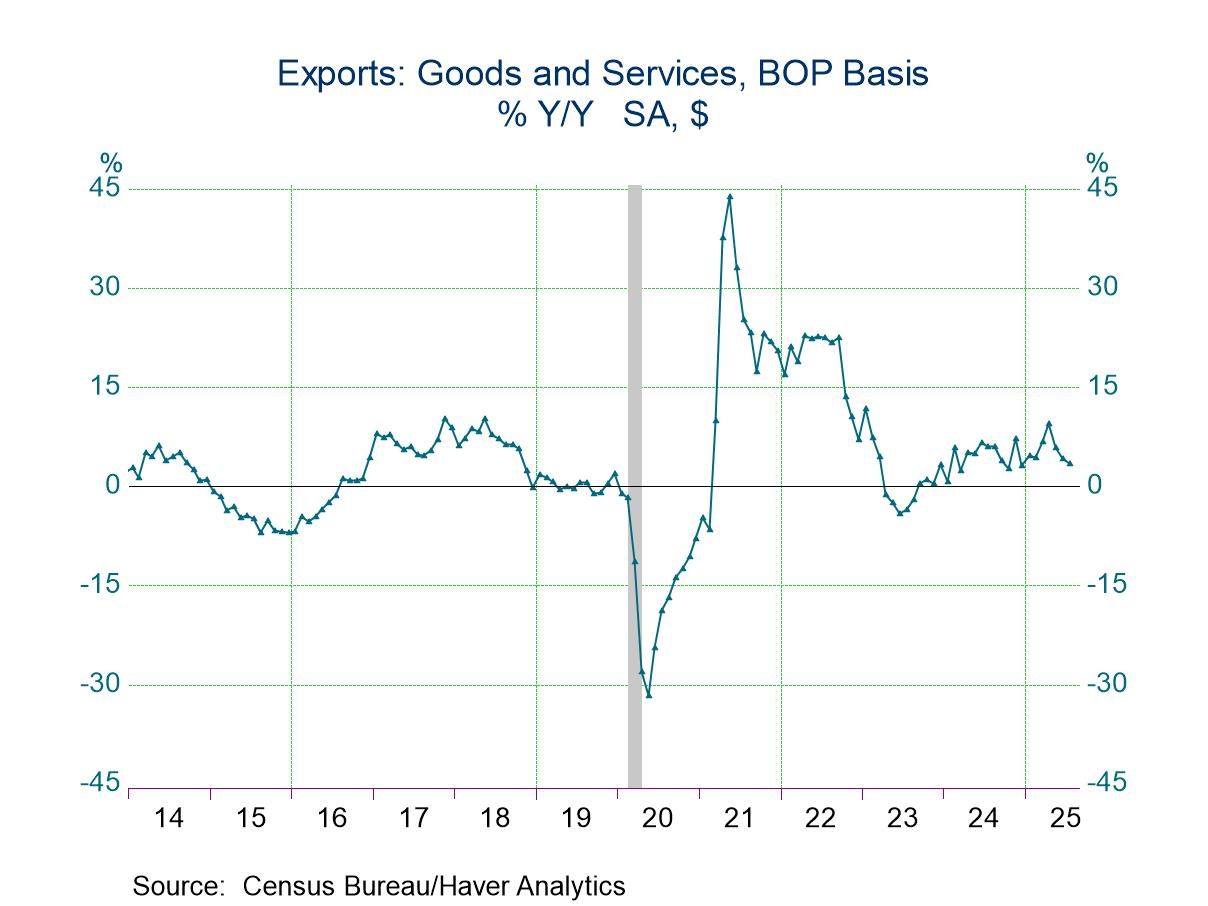
- Exports rebounded, increasing by 0.3% m/m after a 0.3% m/m decline in June.
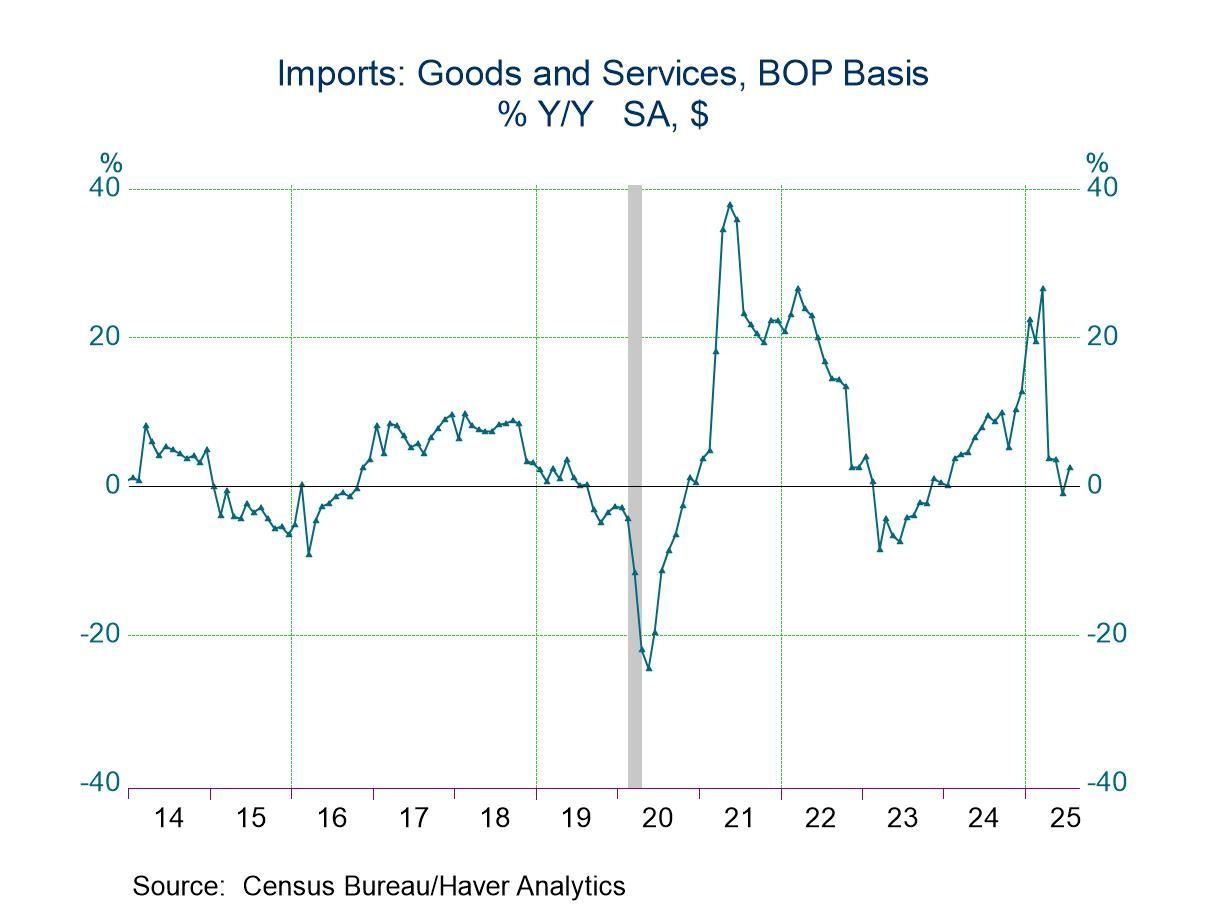
- Imports surged, rising 5.9% following a 3.6% decline in June.
- The July import surge was led by imports of industrial supplies.
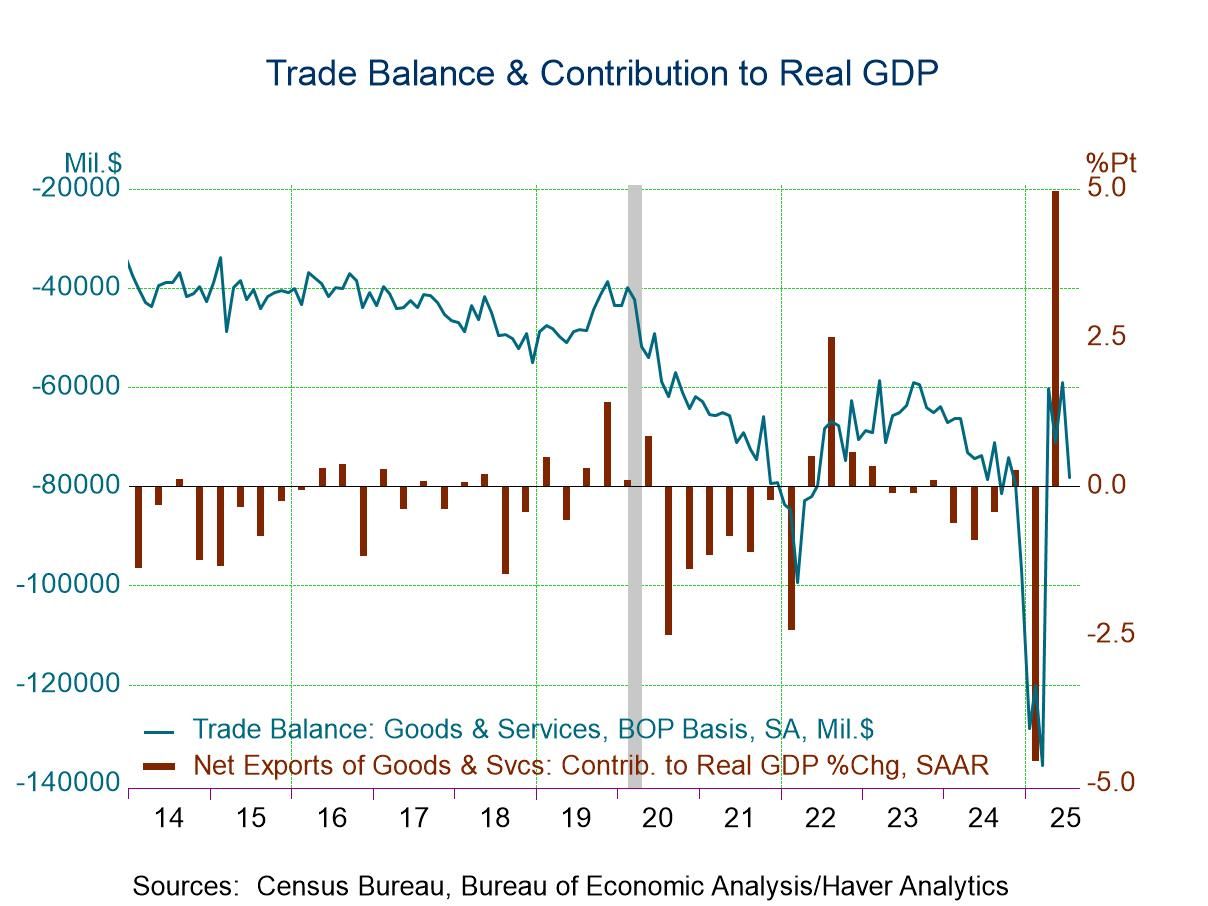
The U.S. trade deficit in goods and services (BOP basis) widened to $78.3 billion in July from a slightly downwardly revised $59.1 billion in June (previously -$60.2 billion), according to the U.S. Census Bureau. This was the largest trade shortfall since March. The Action Economics Forecast Survey expected a deficit of $78.6 billion. The goods deficit ballooned to $103.9 billion from $85.7 billion in June, while the services surplus narrowed to $25.6 billion, its smallest reading since January 2024, from $26.6 billion in June. The real (inflation-adjusted) trade deficit widened to $100.1 billion (2017$) from $84.6 billion in June. The surge in the deficit in July is a very poor beginning for Q3 GDP as it indicates that the trade deficit could once again be a big drag on real GDP growth after contributing nearly 5%-points in Q2.
The marked widening in the goods trade deficit was led by a 25.9% m/m surge in imports of industrial goods. This once again reflected an outsized jump in imports of nonmonetary gold but also contained a significant increase in copper imports. The jump in nonmonetary gold imports will not be included in the calculation of real GDP but the jump in copper imports will.
Goods exports were essentially unchanged in July (+3.2% y/y) after having fallen 0.6% m/m in June. Auto exports increased 2.7%, the third monthly gain. Capital goods exports excluding autos rose 0.9% m/m. In contrast, exports of industrial supplies fell 0.4% m/m, their third consecutive monthly decline. Exports of consumer goods excluding autos slid 0.9% m/m, their first decline in three months.
Goods imports jumped 7.0% m/m (+1.6% y/y) after having declined in each of the preceding three months. As noted above, the July jump was led by a surge in imports of industrial supplies. In this category, imports of nonmonetary gold surged more than $9 billion while copper rebounded. Capital goods imports rose a solid 5.1% m/m, and imports of consumer goods excluding autos increased 2.2% m/m after a 12.7% fall in June. In contrast, auto imports fell 4.0% m/m, their third monthly decline in the past four months.
Services exports edged up 0.6% m/m (4.8% y/y) in July. Transport services exports rose 3.1% m/m; charges for use of intellectual property increased 1.5% m/m; exports of government goods and services jumped 5.5% m/m, the first monthly gain in ten months. In contrast, travel exports fell 1.7% m/m. Services imports increased 2.3% m/m (+6.7% y/y) in July. The monthly increase was widespread across major sectors. Travel increased 3.4% m/m; transport services rose 4.7% m/m; imported construction services gained 3.4% m/m, their first monthly gain in seven months; imports of telecommunications and information services increased 1.9% m/m.
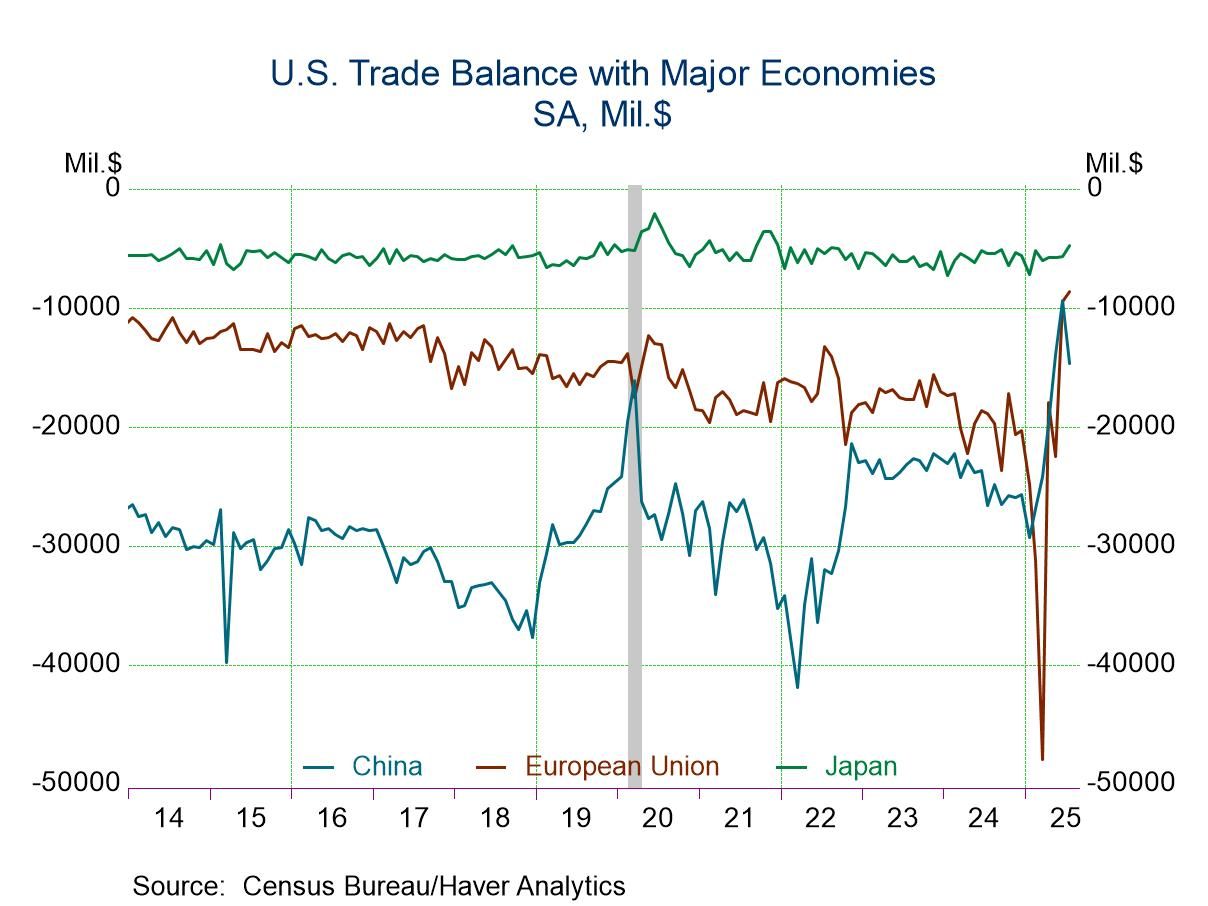
After having narrowed in each of the previous five months, the goods trade deficit with China in July widened to $14.7 billion from $9.4 billion in June. Exports to China edged down 0.2% m/m while imports from China jumped 27.3% m/m, their largest monthly increase since 2020. The trade deficit with the European Union narrowed further to $8.6 billion in July from $9.5 billion in June. The deficit with Japan narrowed further to $4.8 billion from $5.7 billion in June.
The international trade data can be found in Haver’s USECON database. Detailed figures on international trade are available in the USINT and USTRADE databases. The expectations figures are from the Action Economics Forecast Survey in AS1REPNA.

Sandy Batten
AuthorMore in Author Profile »Sandy Batten has more than 30 years of experience analyzing industrial economies and financial markets and a wide range of experience across the financial services sector, government, and academia. Before joining Haver Analytics, Sandy was a Vice President and Senior Economist at Citibank; Senior Credit Market Analyst at CDC Investment Management, Managing Director at Bear Stearns, and Executive Director at JPMorgan. In 2008, Sandy was named the most accurate US forecaster by the National Association for Business Economics. He is a member of the New York Forecasters Club, NABE, and the American Economic Association. Prior to his time in the financial services sector, Sandy was a Research Officer at the Federal Reserve Bank of St. Louis, Senior Staff Economist on the President’s Council of Economic Advisors, Deputy Assistant Secretary for Economic Policy at the US Treasury, and Economist at the International Monetary Fund. Sandy has taught economics at St. Louis University, Denison University, and Muskingun College. He has published numerous peer-reviewed articles in a wide range of academic publications. He has a B.A. in economics from the University of Richmond and a M.A. and Ph.D. in economics from The Ohio State University.
More Economy in Brief


 Global