U.S. Retail Sales Jumped in March only Partly Due to Surging Gasoline Prices
by:Sandy Batten
|in:Economy in Brief
Summary
- Total sales jumped 1.7% m/m in March with small upward revisions to January and February.
- Gasoline sales surged 15.5% m/m in March, but even excluding that increase, the remainder of retail sales rose 0.6% m/m.
- Excluding autos, sales soared 1.9% m/m in March with small upward revisions to January and February.
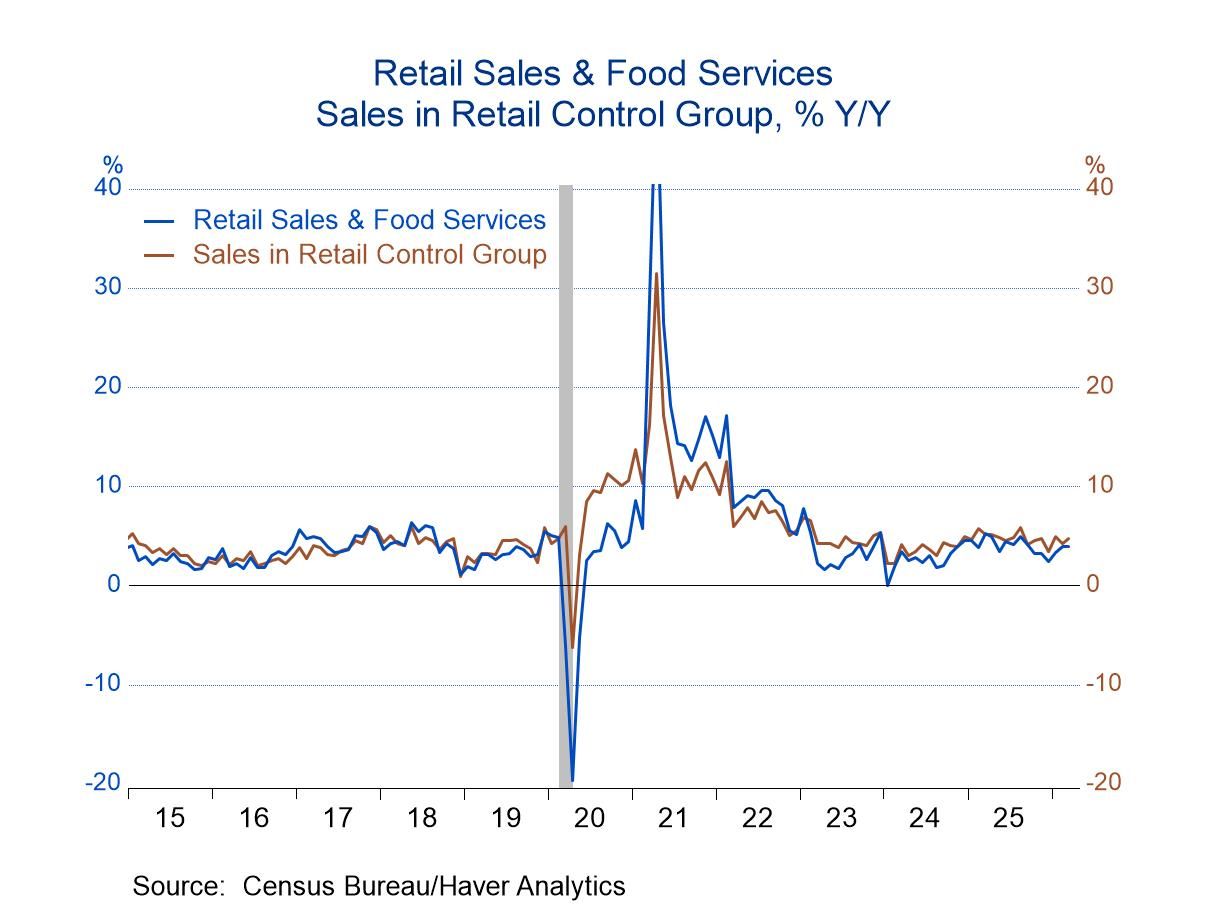
- Sales of the retail control group that is used to construct PCE rose 0.7% m/m in March and 1.2% q/q for all of Q1.
Total retail sales rose a larger-than-expected 1.7% m/m (+4.0% y/y) in March following an upwardly revised 0.7% m/m gain in February (previously +0.6% m/m) in February, according to data from the U.S. Census Bureau. The Action Economics Forecast Survey looked for a 1.4% m/m increase. Excluding autos, other sales soared 1.9% m/m (+5.5% y/y) in March after an upwardly revised 0.7% monthly gain in February (previously +0.5% m/m). The Action Economics Forecast Survey looked for a 1.4% m/m increase in sales excluding autos. The March increase in total sales was the largest monthly increase since last March while the March jump in ex-auto sales was the largest monthly gain since January 2023.
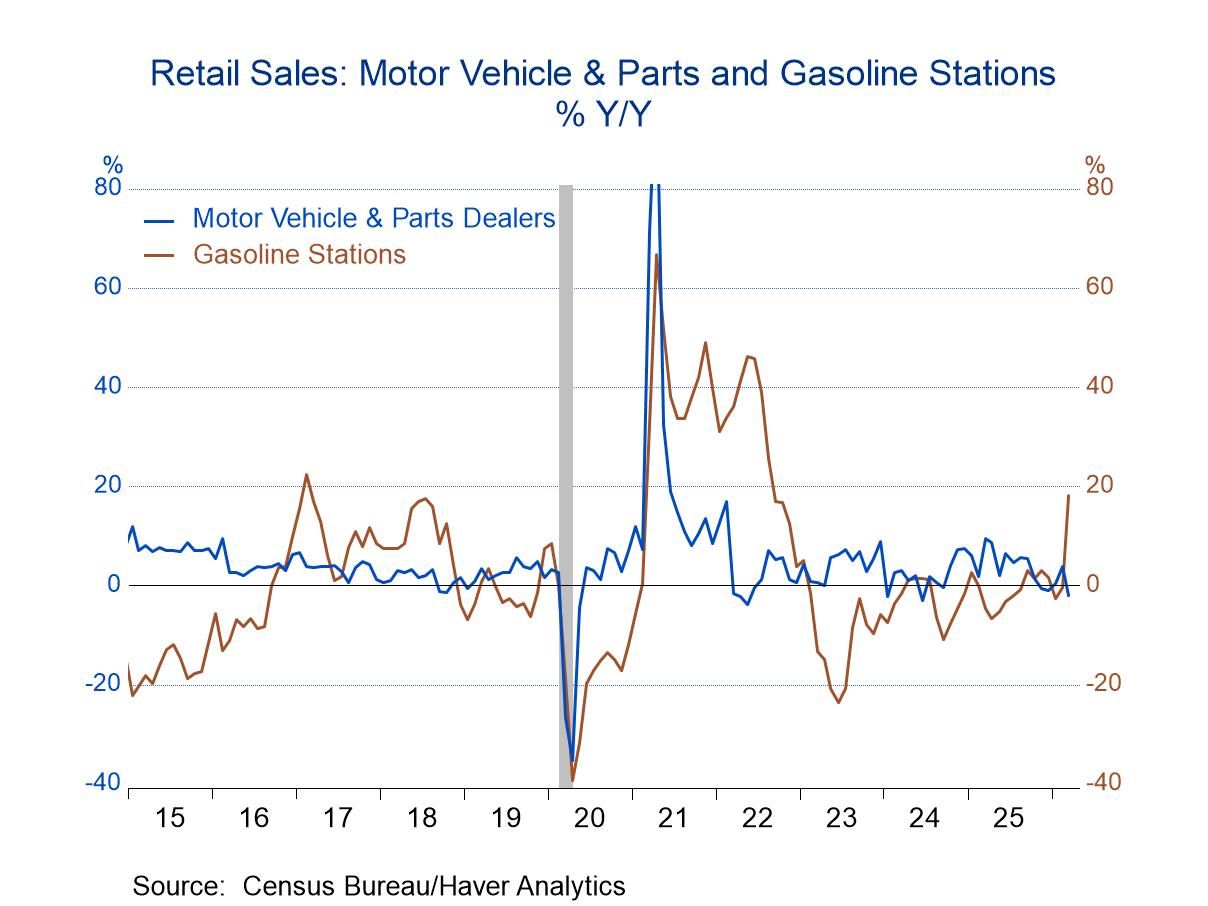
As expected, a 15.5% m/m surge in sales at gasoline stations, largely reflecting a previously reported 21.2% m/m jump in retail gasoline prices, accounted for much of the monthly increase in both overall and ex-auto sales in March. However, sales were solid even without gasoline sales. Total sales excluding gasoline rose 0.6% in March versus a 0.7% monthly gain in February. Sales excluding both autos and gasoline increased 0.6% m/m in March, the same rise as in February. Forecasters expected only a 0.2% m/m increase in sales ex both autos and gasoline.
The control group of sales (total sales excluding food services, autos, gasoline and building materials that the BEA uses to construct PCE in the national accounts) posted another solid increase in March, rising 0.7% m/m following an upwardly revised 0.6% monthly increase in February (previously +0.5% m/m). For all of Q1, control group sales were up 1.2% q/q, up from a 0.7% quarterly gain in Q4. This points to a somewhat surprising pickup in household spending growth when Q1 GDP is reported on April 30. Many analysts had feared that the sharp rise in gasoline prices would put significant stress on household finances and thereby slow spending. A possible explanation for the recent resilience of sales is larger income tax refunds this year owing to the OBBBA which reduced taxes during last year while the withholding tables were not adjusted until this year (resulting in more over-withholding last year).
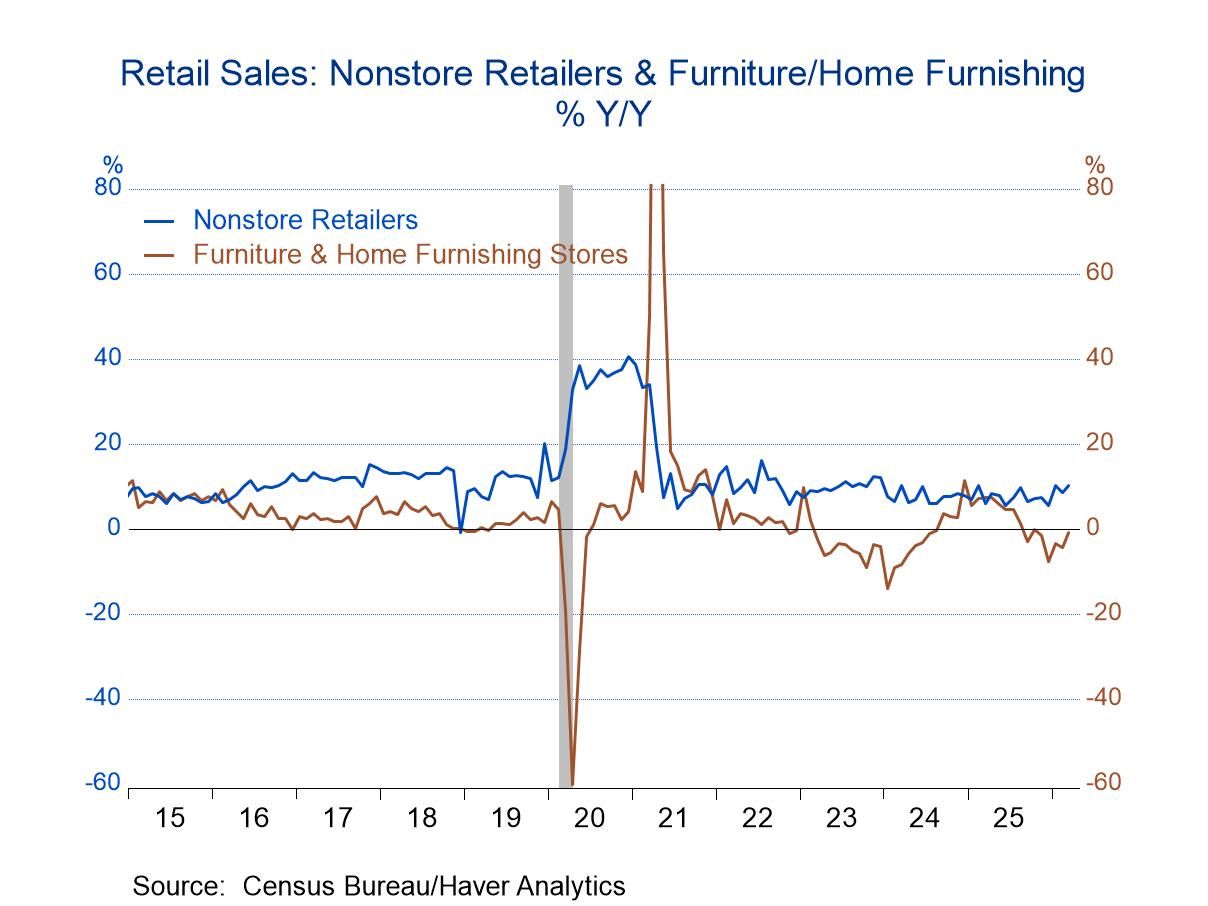
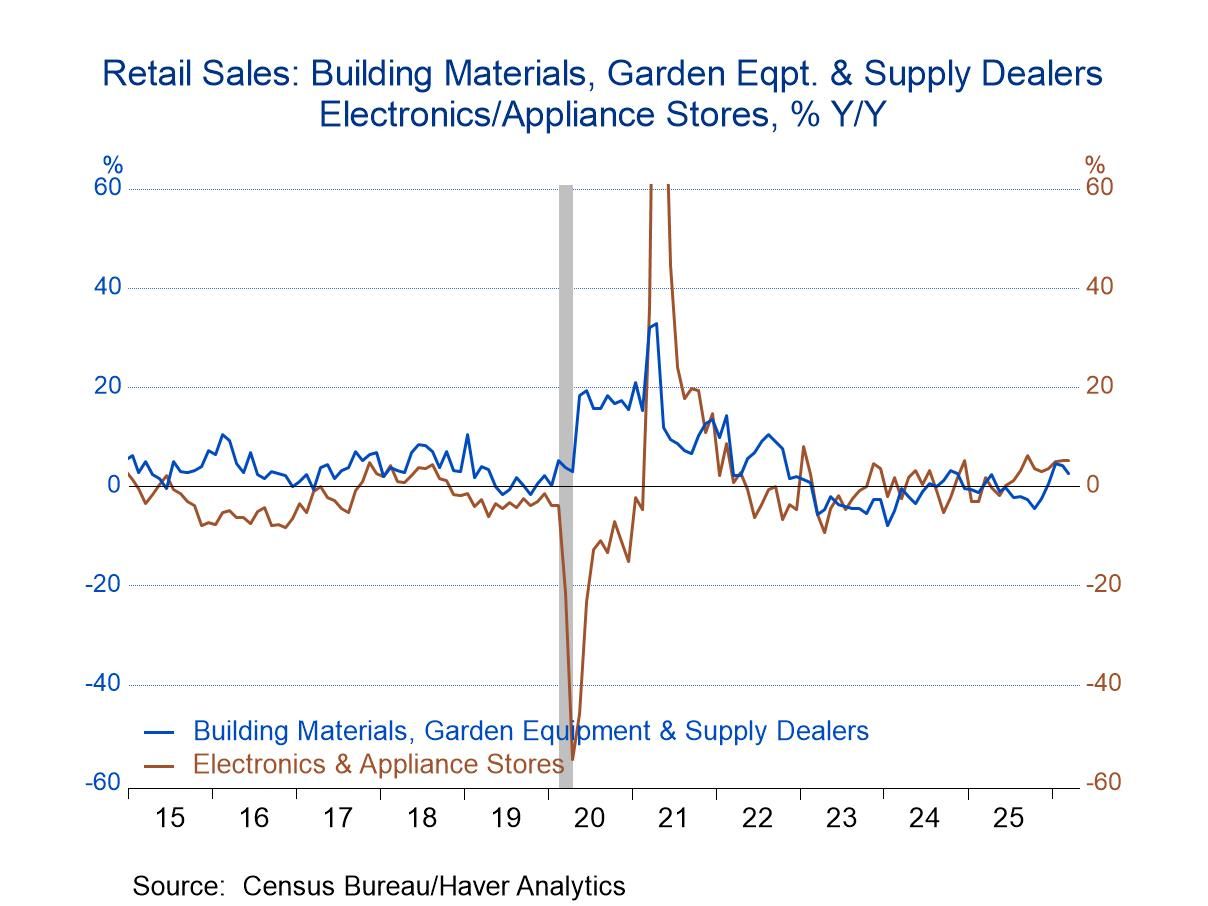
Sales across major sectors generally posted solid gains in March. Auto sales rose 0.5% m/m on top of a 1.0% m/m increase in February. Furniture and appliance sales jumped 1.6%, the third consecutive monthly gain and the largest since December 2024. General merchandise store sales jumped 1.0% m/m, their largest monthly gain since April 2023. Nonstore retail sales increased 1.0% m/m in March, their third consecutive month with an increase of 1% or more. Building material and garden supply store sales rose 0.7% m/m in March, their fifth consecutive monthly increase. Sales at food and beverage stores increased 0.7% m/m in March, their first monthly gain in three months. By contrast, clothing sales were unchanged following a 2.8% monthly jump in February. Sales at sporting goods, book and music stores were also unchanged in March after a 0.7% monthly rise in February. Eating out sales edged up 0.1% m/m in March following a 0.5% m/m increase in February. The only major category posting a monthly decline in March was “miscellaneous” sales which fell 0.9% m/m but this was after 2.2% m/m gains in both January and February.
Retail sales data can be found in Haver’s USECON database. The expectations figures are from the Action Economics Forecast Survey in AS1REPNA.

Sandy Batten
AuthorMore in Author Profile »Sandy Batten has more than 30 years of experience analyzing industrial economies and financial markets and a wide range of experience across the financial services sector, government, and academia. Before joining Haver Analytics, Sandy was a Vice President and Senior Economist at Citibank; Senior Credit Market Analyst at CDC Investment Management, Managing Director at Bear Stearns, and Executive Director at JPMorgan. In 2008, Sandy was named the most accurate US forecaster by the National Association for Business Economics. He is a member of the New York Forecasters Club, NABE, and the American Economic Association. Prior to his time in the financial services sector, Sandy was a Research Officer at the Federal Reserve Bank of St. Louis, Senior Staff Economist on the President’s Council of Economic Advisors, Deputy Assistant Secretary for Economic Policy at the US Treasury, and Economist at the International Monetary Fund. Sandy has taught economics at St. Louis University, Denison University, and Muskingun College. He has published numerous peer-reviewed articles in a wide range of academic publications. He has a B.A. in economics from the University of Richmond and a M.A. and Ph.D. in economics from The Ohio State University.
More Economy in Brief


 Global
