U.S. Producer Prices Rise in September Led by Energy
Summary
- Sept. PPI increases 0.3% m/m (+2.7% y/y), driven by price rises of 3.5% in energy and 1.1% in foods.
- PPI ex foods & energy edges up 0.1%; prices for both services and construction hold steady.
- Core goods prices increase 0.2% (+2.9% y/y) after a 0.3% August gain.
- Intermediate demand processed goods prices up for the fifth time in six months.
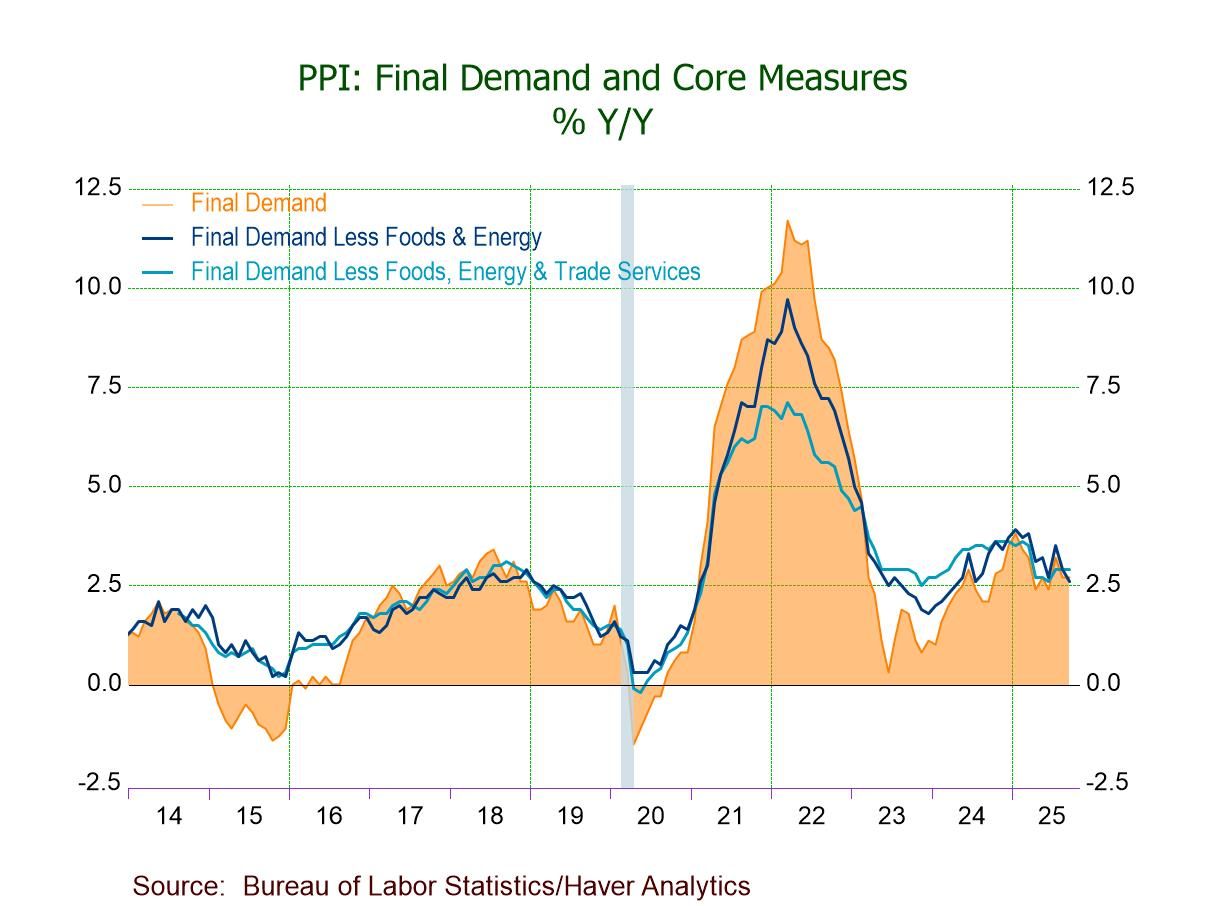
The Producer Price Index for final demand rose an expected 0.3% m/m in September following a 0.1% easing in August (unrevised) and a 0.8% rise in July (+0.7% previously), according to the Bureau of Labor Statistics. The September reading was the fourth m/m increase in five months. The year-over-year rate held at 2.7% in September and August after accelerating to 3.2% in July. The latest m/m increase matched expectations in the Action Economics Forecast Survey. September PPI figures, compared with September CPI data +0.3% m/m, +3.0% y/y (released on October 24), reinforce the view that U.S. inflationary pressures remain elevated on both producer and consumer sides.
Producer prices excluding food & energy edged up 0.1% (2.6% y/y) in September after a 0.1% downtick in August (unrevised) and a 0.8% gain in July (+0.7% previously). A 0.3% m/m increase had been expected. Another core price measure, producer prices less food, energy & trade services ticked up 0.1% (2.9% y/y), the fifth straight m/m increase, after rises of 0.3% in August (unrevised) and 0.7% in July (+0.6% previously).
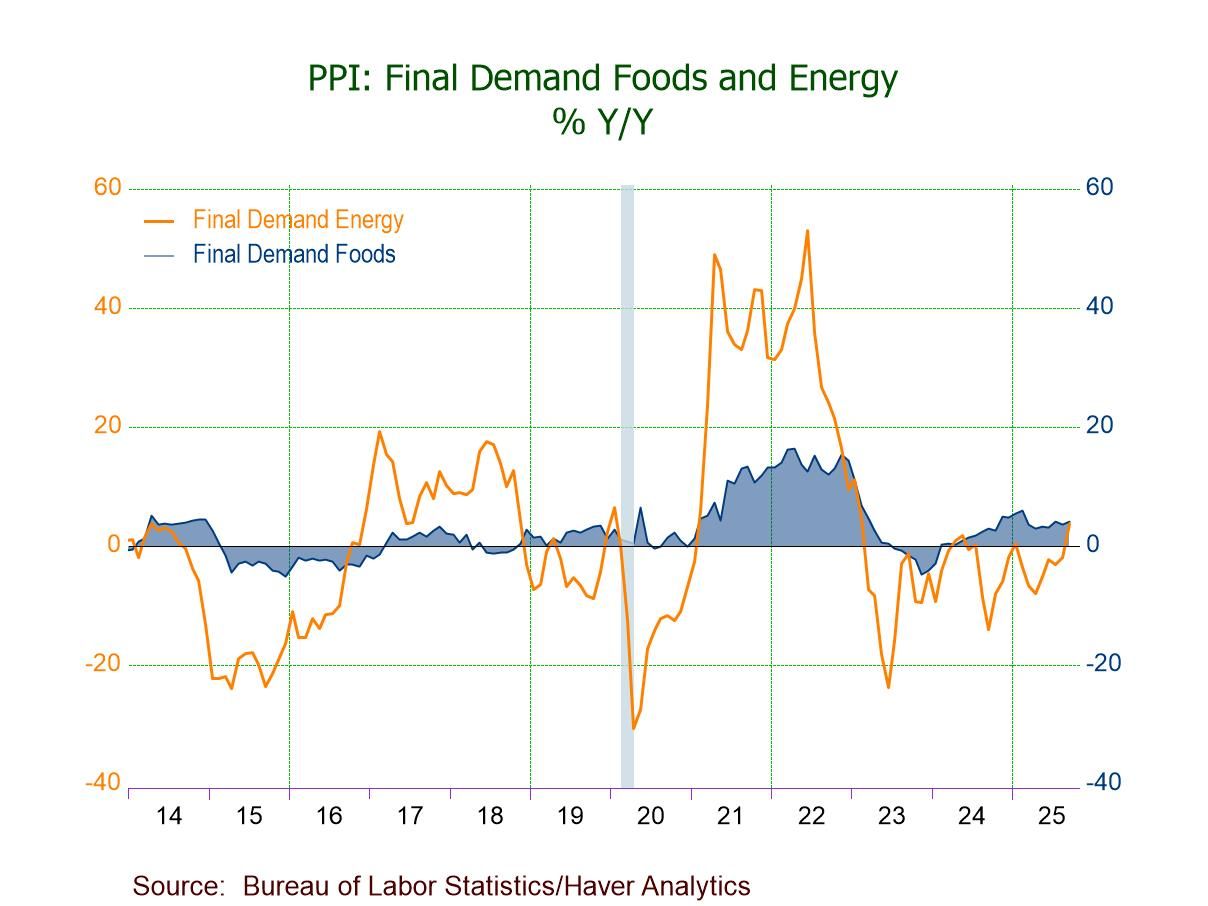
The September PPI 0.3% m/m rise was led by a 3.5% jump (3.8% y/y) in energy prices, the third m/m increase in four months, following a 0.4% August decline. The jump in energy prices reflected m/m price rises of 11.8% (1.0% y/y) in gasoline, 9.8% (-1.1% y/y) in natural gas liquids, 5.9% (6.5% y/y) in home heating oil & distillates, and 0.5% (4.7% y/y) in residential electric power. In contrast, prices for residential natural gas (-0.5%; +11.9% y/y) and diesel fuel (-0.2%; +8.2% y/y) fell m/m in September.
Food prices rose 1.1% (4.0% y/y) in September, the fourth consecutive m/m rise, after increases of 0.1% in August (unrevised) and 1.5% in July (+1.4% previously). Food prices for exports (1.9%; 4.7% y/y), government purchased foods (1.5%; 7.0% y/y) and finished consumer foods (0.9%; 3.7% y/y) all increased m/m in September.
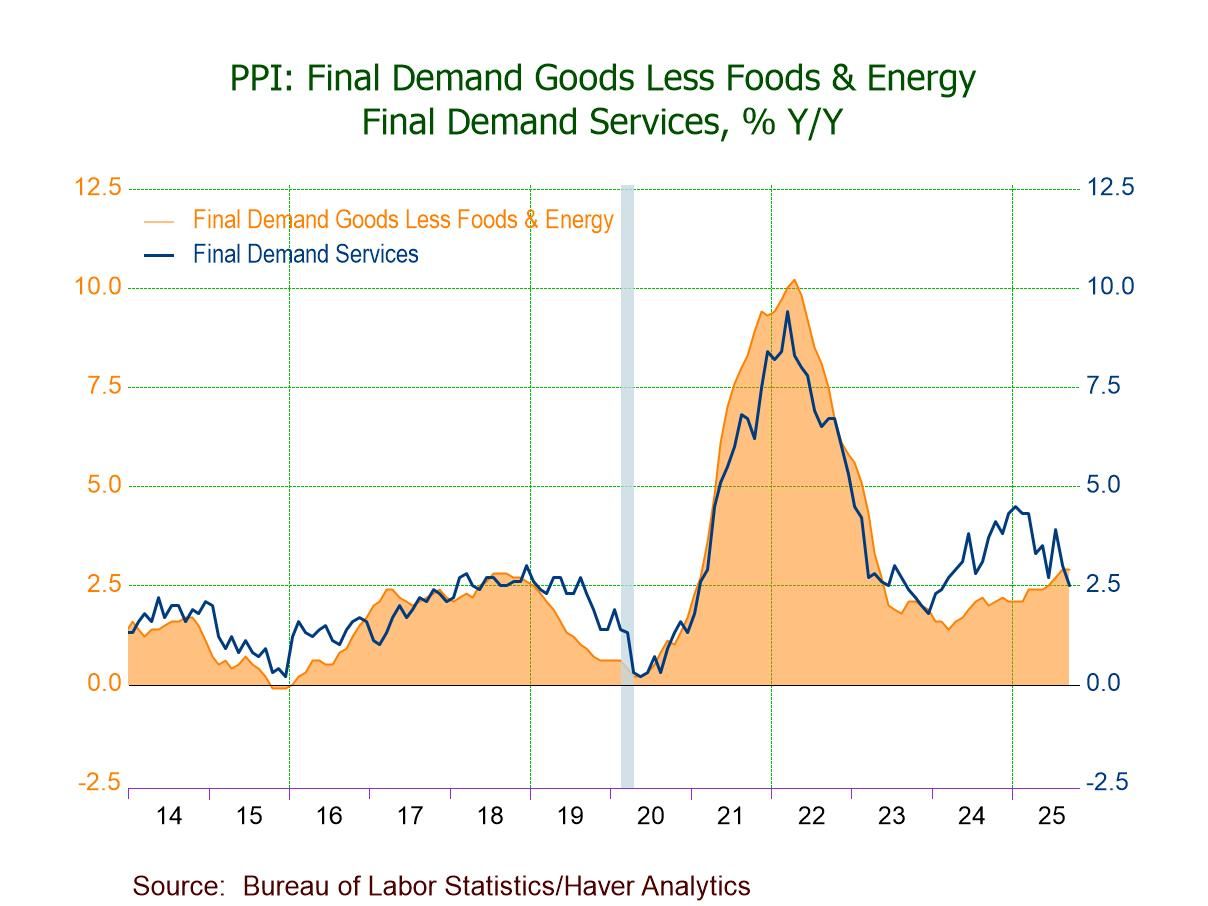
The PPI for final demand goods advanced 0.9% (3.3% y/y) in September, the fifth straight m/m rise, on top of a 0.2% increase in August (+0.1% initially). The PPI for final demand goods less food & energy rose 0.2% (2.9% y/y) in September after a 0.3% increase in August, continuing its string of m/m gains since April 2024. Prices for final demand finished goods less food & energy rose 0.2% (2.9% y/y) after a 0.4% August rise. Finished consumer goods prices less food & energy edged up 0.1% (2.5% y/y) in September after a 0.5% advance in August, with durable consumer goods prices up 0.2% (2.6% y/y) and core nondurable consumer goods prices up 0.1% (2.4% y/y). Prices for private capital equipment rose 0.2% (3.3% y/y) in September and August, while prices for government purchased goods excluding foods & energy increased 0.1% (2.8% y/y) for the second successive month.
Prices for final demand services were unchanged (2.5% y/y) in September following a 0.3% decline in August (-0.2% initially) and a 0.9% gain in July (+0.7% previously). Trade services prices fell 0.2% (+1.5% y/y) in September, the third m/m fall in four months. Services prices of transportation & warehousing rose 0.8% (3.4% y/y) in September, the third consecutive m/m rise, while services prices less trade, transportation & warehousing ticked up 0.1% (2.9% y/y), the fifth straight m/m increase.
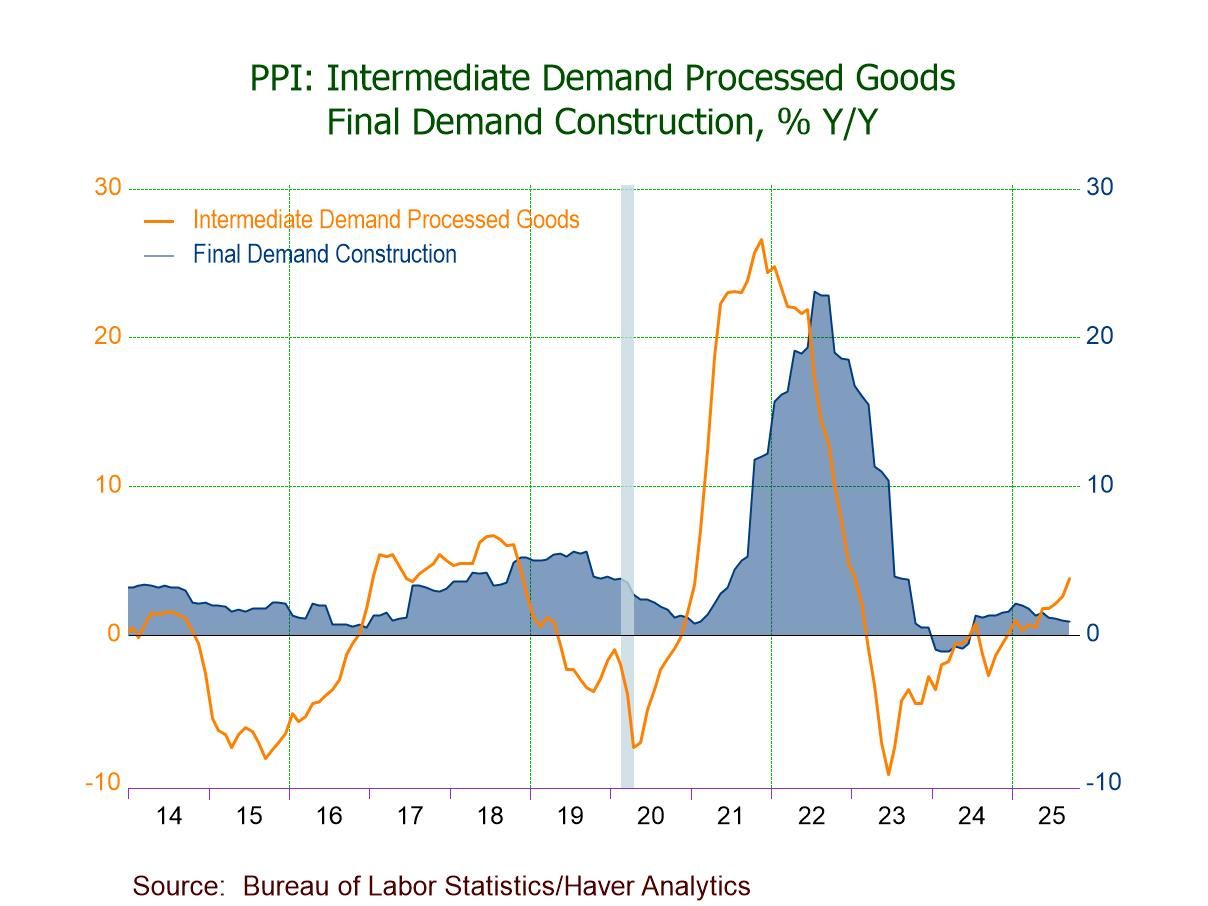
Prices for final demand construction held steady (0.9% y/y) in September following a 0.1% downtick in August (unrevised) and three successive m/m rises. Construction prices for private capital investment were flat (0.7% y/y) in September, while construction prices for government ticked up 0.1% (1.4% y/y); both categories saw a 0.1% decline in August.
Meanwhile, prices for intermediate demand processed goods rose 0.4% (3.8% y/y) in September, the fifth m/m gain in six months, on top of a 0.4% rise in August (unrevised), led by a 0.9% increase (4.0% y/y) in intermediate demand processed fuel & lubricant costs.
The PPI data are published by the Bureau of Labor Statistics and can be found in Haver’s USECON database. Further detail is contained in PPI and PPIR. The expectations figures are available in the AS1REPNA database.

Winnie Tapasanun
AuthorMore in Author Profile »Winnie Tapasanun has been working for Haver Analytics since 2013. She has 20+ years of working in the financial services industry. As Vice President and Economic Analyst at Globicus International, Inc., a New York-based company specializing in macroeconomics and financial markets, Winnie oversaw the company’s business operations, managed financial and economic data, and wrote daily reports on macroeconomics and financial markets. Prior to working at Globicus, she was Investment Promotion Officer at the New York Office of the Thailand Board of Investment (BOI) where she wrote monthly reports on the U.S. economic outlook, wrote reports on the outlook of key U.S. industries, and assisted investors on doing business and investment in Thailand. Prior to joining the BOI, she was Adjunct Professor teaching International Political Economy/International Relations at the City College of New York. Prior to her teaching experience at the CCNY, Winnie successfully completed internships at the United Nations. Winnie holds an MA Degree from Long Island University, New York. She also did graduate studies at Columbia University in the City of New York and doctoral requirements at the Graduate Center of the City University of New York. Her areas of specialization are international political economy, macroeconomics, financial markets, political economy, international relations, and business development/business strategy. Her regional specialization includes, but not limited to, Southeast Asia and East Asia. Winnie is bilingual in English and Thai with competency in French. She loves to travel (~30 countries) to better understand each country’s unique economy, fascinating culture and people as well as the global economy as a whole.
More Economy in Brief


 Global