U.S. Pending Home Sales Up for Second Consecutive Month in March
Summary
- PHSI +1.5% m/m (-1.1% y/y) to 73.7 in Mar., highest level since Nov.
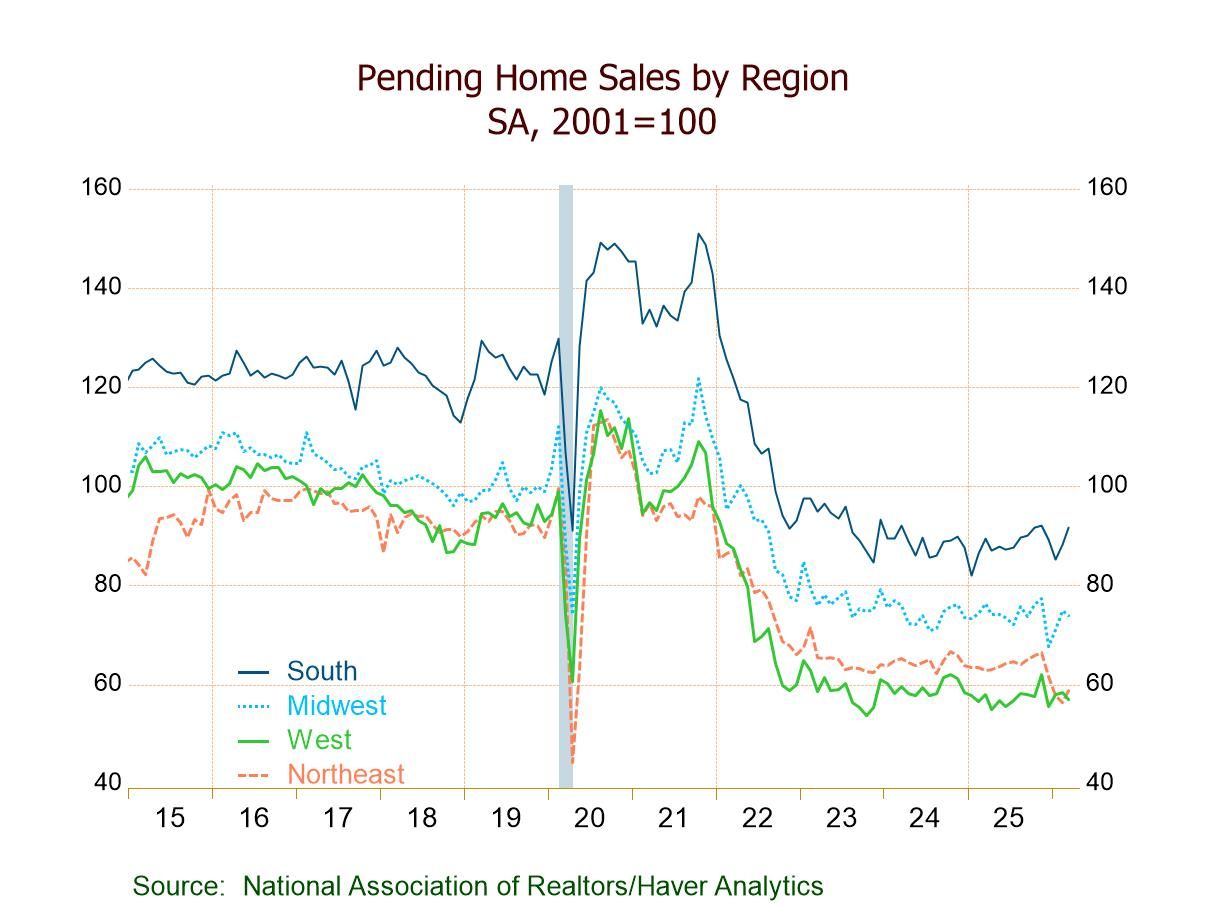
- Home sales m/m up in the Northeast (+4.4%) and South (+3.9%); down in the Midwest (-1.3%) and West (-2.6%).
- Home sales y/y down in the Northeast (-6.5%), Midwest (-3.1%), and West (-1.7%); up in the South (+2.3%).
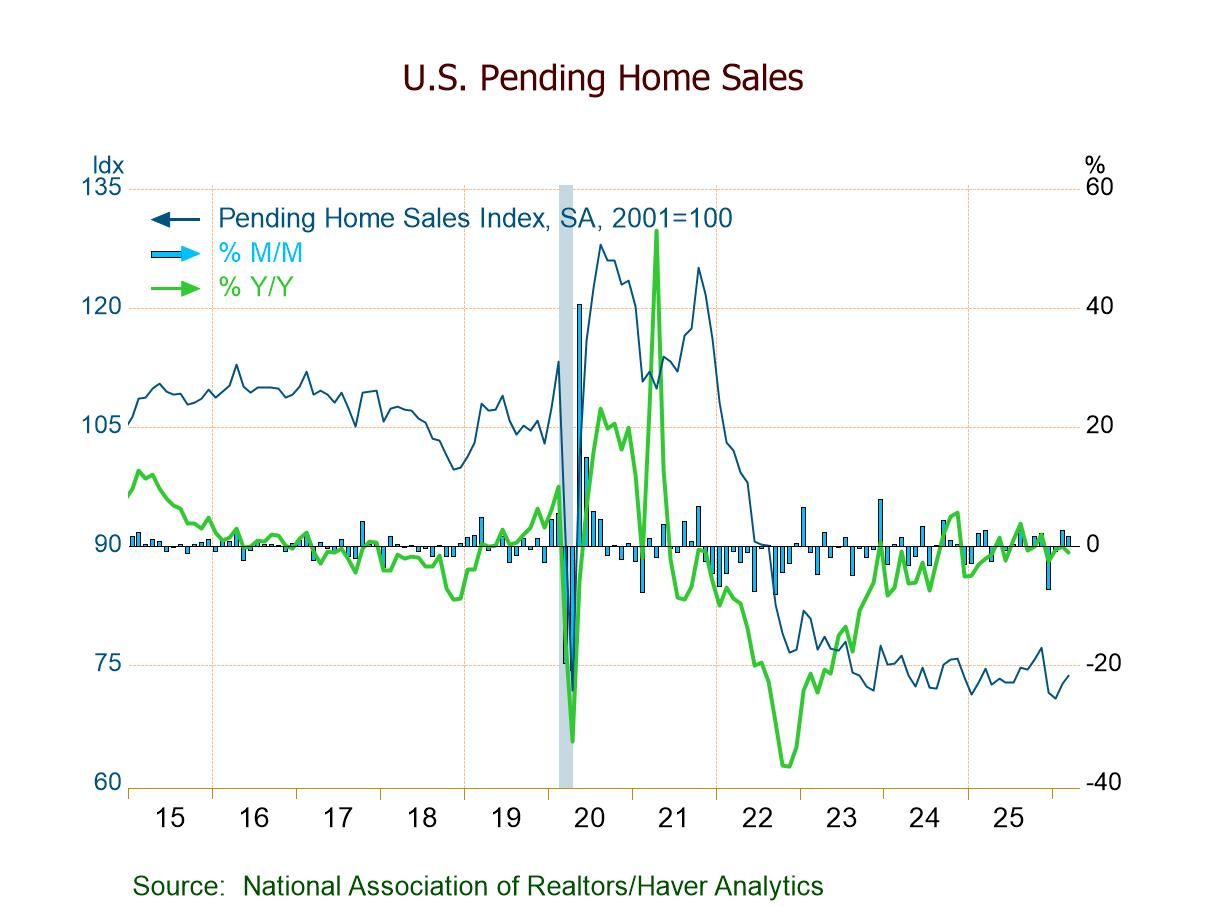
The Pending Home Sales Index, a forward-looking measure of home sales based on contract signings, rose 1.5% m/m to 73.7 in March following an upwardly revised 2.5% gain in February (+1.8% initially) and a 1.0% decline in January (unrevised), according to the National Association of Realtors (NAR). March marked the second straight m/m rise and the highest index level since November (77.2). The year-on-year rate was -1.1% in March, the fourth consecutive negative y/y reading, compared to -0.1% in February and -2.1% in March 2025. The index had fallen 41.1% since its October 2021 high of 125.1.
The m/m rise in March pending home sales coincided with an increase in the average 30-year fixed mortgage rate to a three-month-high 6.18% in March after a 6-bps decline to 6.05% in February. These rates, while below a peak of 7.62% in October 2023, had remained above a low of 5.22% in August 2022 and more than double a record-low 2.68% in December 2020.
By region, March pending home sales showed a mixed performance. Sales in the Northeast rebounded 4.4% (-6.5% y/y) in March, the first m/m increase since November, after a 2.6% decrease in February. Sales in the South rose 3.9% (2.3% y/y) following a 3.5% February rise and two successive m/m declines. Sales in the West dropped 2.6% (-1.7% y/y) after a 0.9% February increase, and sales in the Midwest fell 1.3% (-3.1% y/y) after a 5.5% February gain; both regions declined m/m for the first time since December.
The pending home sales index measures sales at the time the contract for the purchase of an existing home is signed, similar to the Census Bureau's new home sales data. In contrast, the National Association of Realtors' existing home sales data are recorded when the sale is closed, which is usually a couple of months after the sales contract has been signed. In developing the pending home sales index, the NAR found that the level of monthly sales contract activity leads the level of closed existing home sales by about two months.
The series dates back to 2001 and are available in Haver's PREALTOR database. Weekly mortgage interest rates from the Mortgage Bankers Association can be found in the WEEKLY database.

Winnie Tapasanun
AuthorMore in Author Profile »Winnie Tapasanun has been working for Haver Analytics since 2013. She has 20+ years of working in the financial services industry. As Vice President and Economic Analyst at Globicus International, Inc., a New York-based company specializing in macroeconomics and financial markets, Winnie oversaw the company’s business operations, managed financial and economic data, and wrote daily reports on macroeconomics and financial markets. Prior to working at Globicus, she was Investment Promotion Officer at the New York Office of the Thailand Board of Investment (BOI) where she wrote monthly reports on the U.S. economic outlook, wrote reports on the outlook of key U.S. industries, and assisted investors on doing business and investment in Thailand. Prior to joining the BOI, she was Adjunct Professor teaching International Political Economy/International Relations at the City College of New York. Prior to her teaching experience at the CCNY, Winnie successfully completed internships at the United Nations. Winnie holds an MA Degree from Long Island University, New York. She also did graduate studies at Columbia University in the City of New York and doctoral requirements at the Graduate Center of the City University of New York. Her areas of specialization are international political economy, macroeconomics, financial markets, political economy, international relations, and business development/business strategy. Her regional specialization includes, but not limited to, Southeast Asia and East Asia. Winnie is bilingual in English and Thai with competency in French. She loves to travel (~30 countries) to better understand each country’s unique economy, fascinating culture and people as well as the global economy as a whole.
More Economy in Brief
 Asia
Asia

