U.S. ISM Manufacturing PMI at Highest Level Since May ’22; New Orders, Production, and Employment Growing
Summary
- ISM Mfg. PMI up to 55.6 in July; seventh straight month above 50.
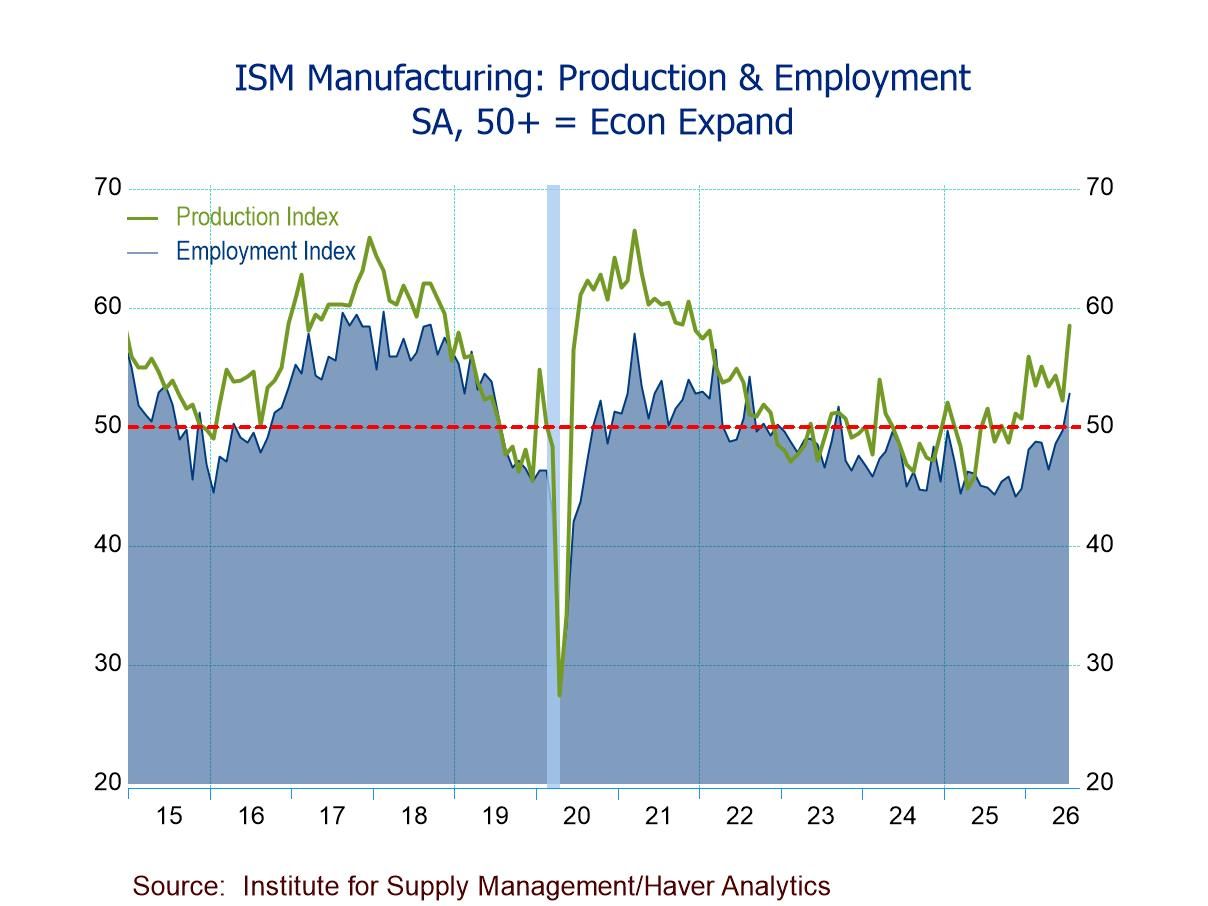
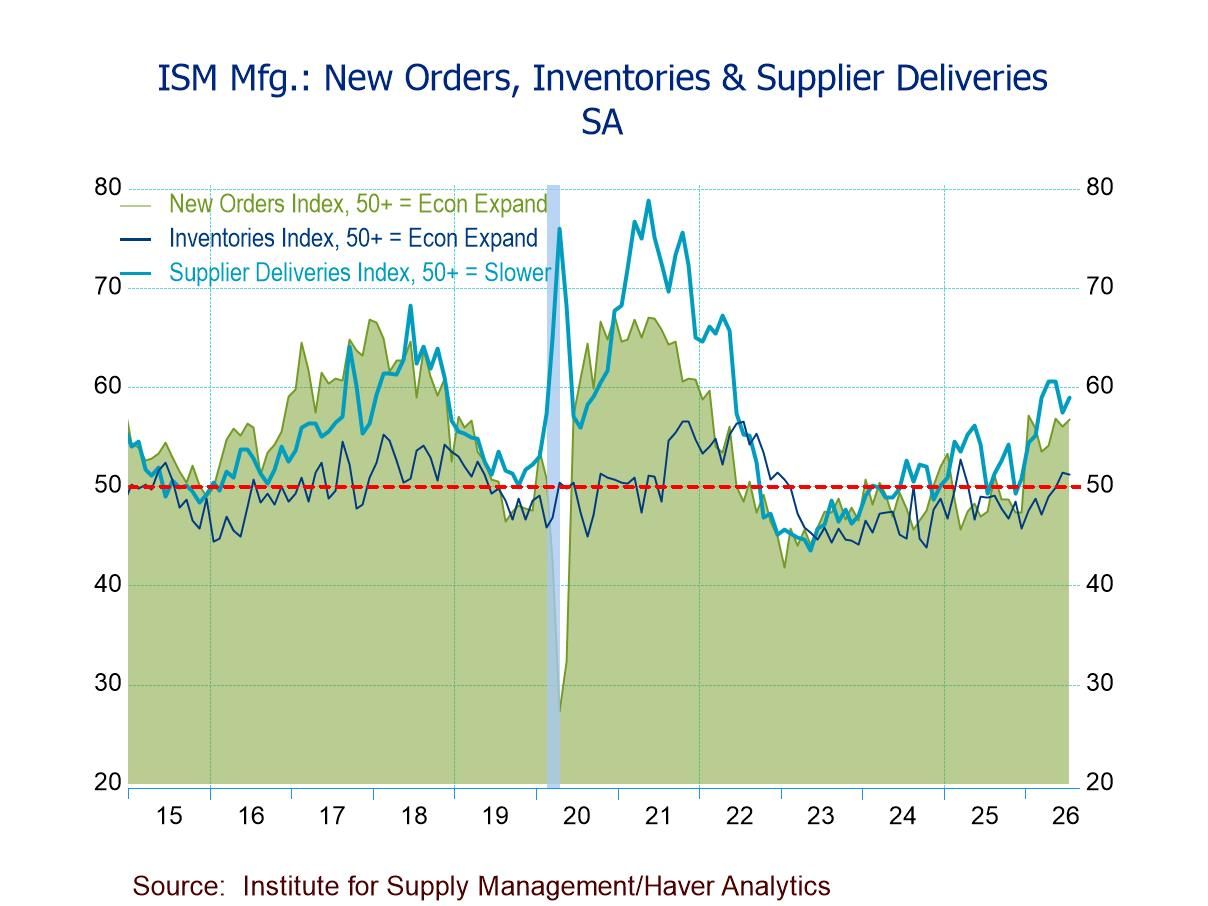
- Production (58.5) reaches highest level since Nov. ’21 and expands for the ninth consecutive mth.; new orders (56.7) for the seventh successive mth.
- Employment (52.8) above 50 for the first time since Sept. ’23; at highest level since Aug. ’22.
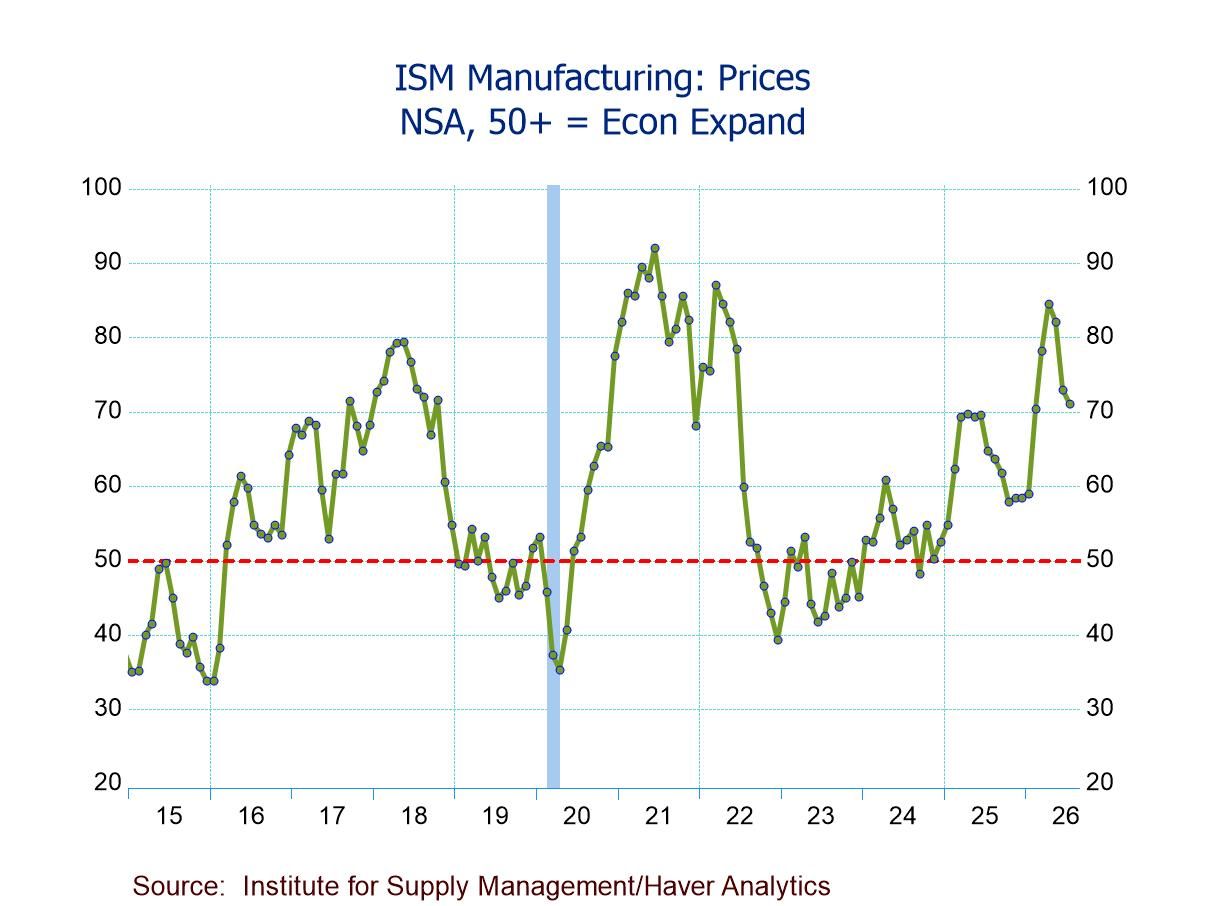
- Prices Index (71.1) at a five-month low, still indicating prices rising for the 22nd straight mth.
- Exports (53.0) highest since Mar. ’22; imports (55.7) highest since June ’21.
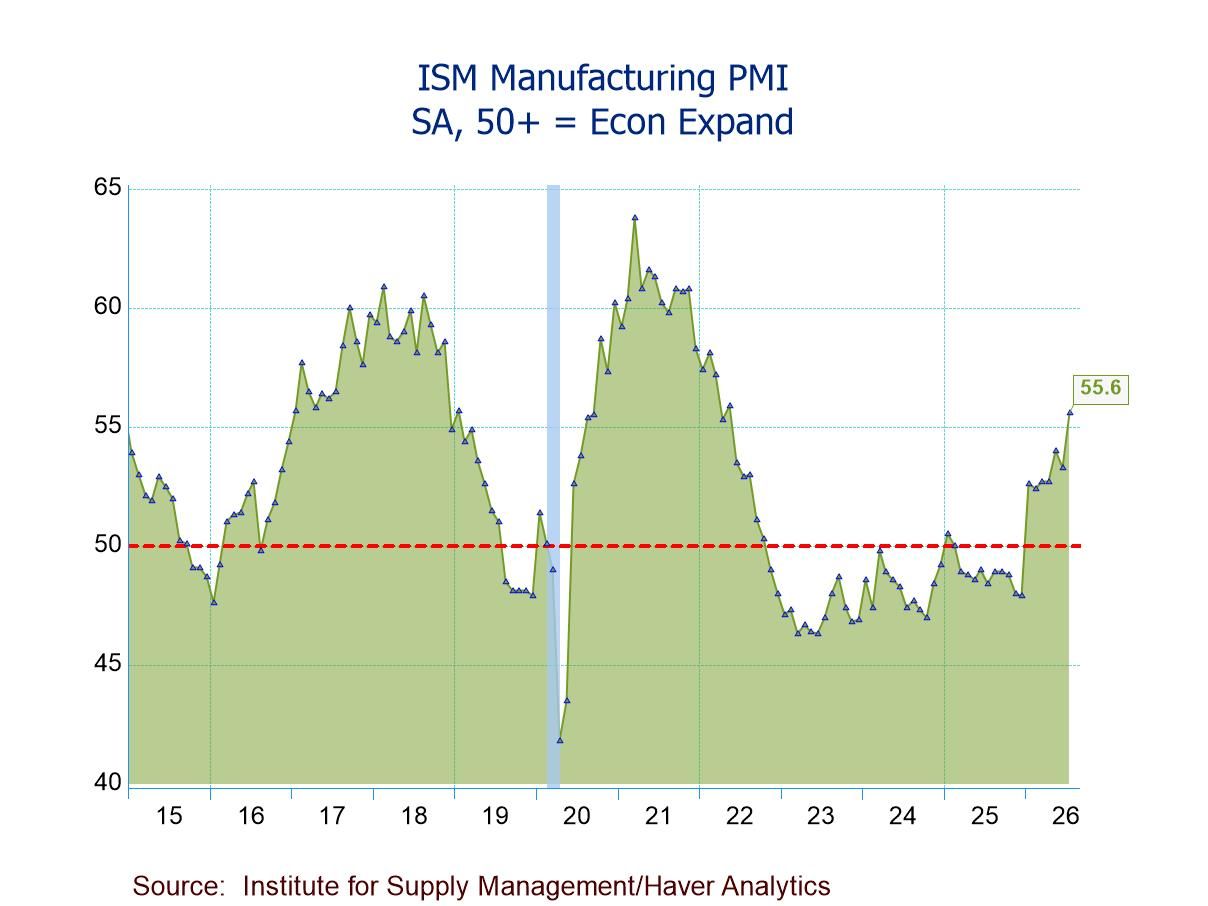
The ISM U.S. manufacturing PMI rose to a higher-than-expected 55.6 in July following a 0.7-point decline to 53.3 in June, according to data from the Institute for Supply Management. The July reading, above the 50 expansion-contraction threshold, indicated the U.S. manufacturing sector expanded for the seventh consecutive month and at the fastest pace since May 2022. A reading of 53.8 for July had been expected in the Action Economics Forecast Survey. The latest manufacturing PMI, while above a contraction-level 48.4 in July 2025 and a low of 47.0 in October 2024, remained below a peak of 63.8 in March 2021.
The production index rebounded to 58.5 in July from 52.2 in June, indicating production expanded for the ninth straight month and at the strongest pace since November 2021. The index was above a low of 44.8 in April 2025 but below a peak of 66.5 in March 2021. In July, 25.1% (NSA) of respondents reported higher production while 10.4% reported lower production. The new orders index increased to 56.7 in July from 56.0 in June, signaling new orders grew for the seventh consecutive month following four successive months of contraction. The index remained well above a low of 41.8 in January 2023 but below a high of 67.0 in May 2021. In July, 25.6% (NSA) of respondents reported higher new orders while 14.2% reported declines. The inventories index slipped to 51.2 in July from 51.4 in June, marking the second month of expansion following 13 months of contraction. The index was slightly below a high of 52.7 in March 2025 but above a low of 43.8 in October 2024. Meanwhile, the supplier deliveries index rose to 58.9 in July from 57.4 in June, indicating slowing delivery performance for the eighth straight month after faster deliveries in November 2025. In July, 21.3% (NSA) of respondents reported slower delivery speeds while 3.5% reported faster speeds.
On the labor front, the employment index advanced to 52.8 in July from 49.7 in June, showing employment expanded for the first time since September 2023 and at the highest level since August 2022. The index was above a low of 44.1 in November 2025 but below a high of 56.5 in March 2022. In July, 16.3% (NSA) of respondents reported higher employment while 13.3% reported lower hiring.
On the pricing front, the prices paid index declined to a still-high 71.1 (NSA) in July following a 9.1-point drop to 73.0 in June, indicating raw materials prices rose for the 22nd consecutive month but at the slowest rising pace since February. The index remained well above a low of 39.4 in December 2022 but below a high of 87.1 in March 2022 and a peak of 92.1 in June 2021. In July, 50.2% (NSA) of respondents reported higher prices while 8.1% reported price declines.
In other ISM series not included in the composite index, the new export orders index rebounded to 53.0 in July from 48.5 in June, indicating new export orders grew for the second time in three months and at the highest level since March 2022. The index was up from a low of 40.1 in May 2025 but down from a peak of 57.1 in February 2022. The imports index rose to 55.7 in July from 52.9 in June, suggesting imports expanded for the sixth successive month and at the strongest rate since June 2021. The index was above a low of 39.9 in May 2025 but below a peak of 61.0 in June 2021. The order backlog index increased to 55.0 (NSA) in July from 50.5 in June, showing backlog levels grew for the seventh straight month and at the fastest pace since February. The index was below a high of 56.6 in February and a peak of 70.6 in May 2021 but well above a low of 37.5 in May 2023.
The ISM figures are based on responses from over 400 purchasing and supply executives from 18 industries, which are weighted according to each industry’s contribution to GDP. These data are diffusion indexes where a reading above 50 indicates expansion; below 50 indicates contraction. The ISM Manufacturing PMI is a composite index based on the diffusion indexes of five of the indexes (seasonally adjusted) with equal weights: New Orders, Production, Employment, Supplier Deliveries, and Inventories. The figures from the Institute for Supply Management can be found in Haver’s USECON database; further detail is found in the SURVEYS database. The expectations number is available in Haver’s AS1REPNA database.

Winnie Tapasanun
AuthorMore in Author Profile »Winnie Tapasanun has been working for Haver Analytics since 2013. She has 20+ years of working in the financial services industry. As Vice President and Economic Analyst at Globicus International, Inc., a New York-based company specializing in macroeconomics and financial markets, Winnie oversaw the company’s business operations, managed financial and economic data, and wrote daily reports on macroeconomics and financial markets. Prior to working at Globicus, she was Investment Promotion Officer at the New York Office of the Thailand Board of Investment (BOI) where she wrote monthly reports on the U.S. economic outlook, wrote reports on the outlook of key U.S. industries, and assisted investors on doing business and investment in Thailand. Prior to joining the BOI, she was Adjunct Professor teaching International Political Economy/International Relations at the City College of New York. Prior to her teaching experience at the CCNY, Winnie successfully completed internships at the United Nations. Winnie holds an MA Degree from Long Island University, New York. She also did graduate studies at Columbia University in the City of New York and doctoral requirements at the Graduate Center of the City University of New York. Her areas of specialization are international political economy, macroeconomics, financial markets, political economy, international relations, and business development/business strategy. Her regional specialization includes, but not limited to, Southeast Asia and East Asia. Winnie is bilingual in English and Thai with competency in French. She loves to travel (~30 countries) to better understand each country’s unique economy, fascinating culture and people as well as the global economy as a whole.
More Economy in Brief
 Asia
Asia