U.S. Initial Unemployment Claims Jumped in Latest Week
by:Sandy Batten
|in:Economy in Brief
Summary
- Initial claims rose more than expected to 225k in the week ending May 30.
- This is the largest weekly claims figure since February 7.
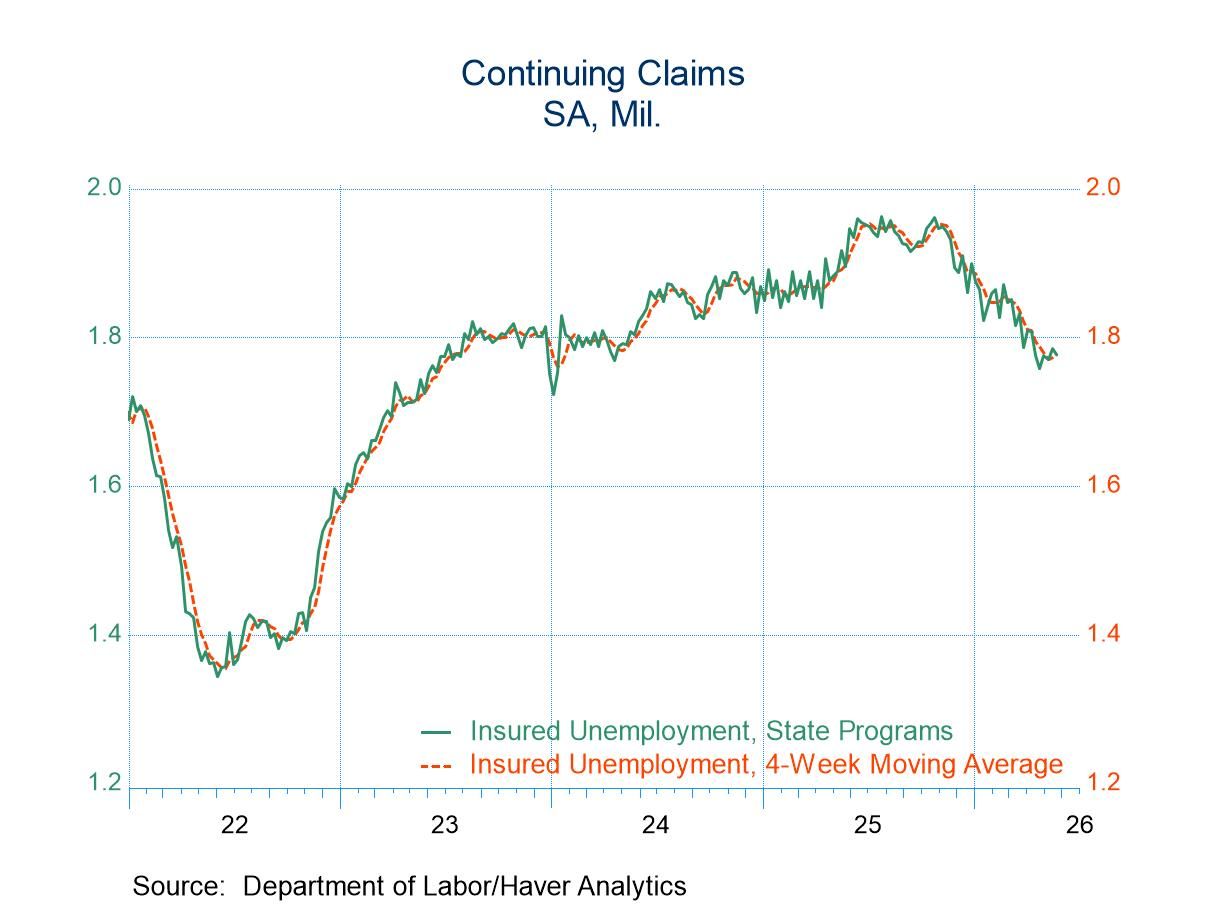
- However, continuing claims continued to trend down, falling to 1.777 million in the week ending May 23 from 1.785 million in the previous week.
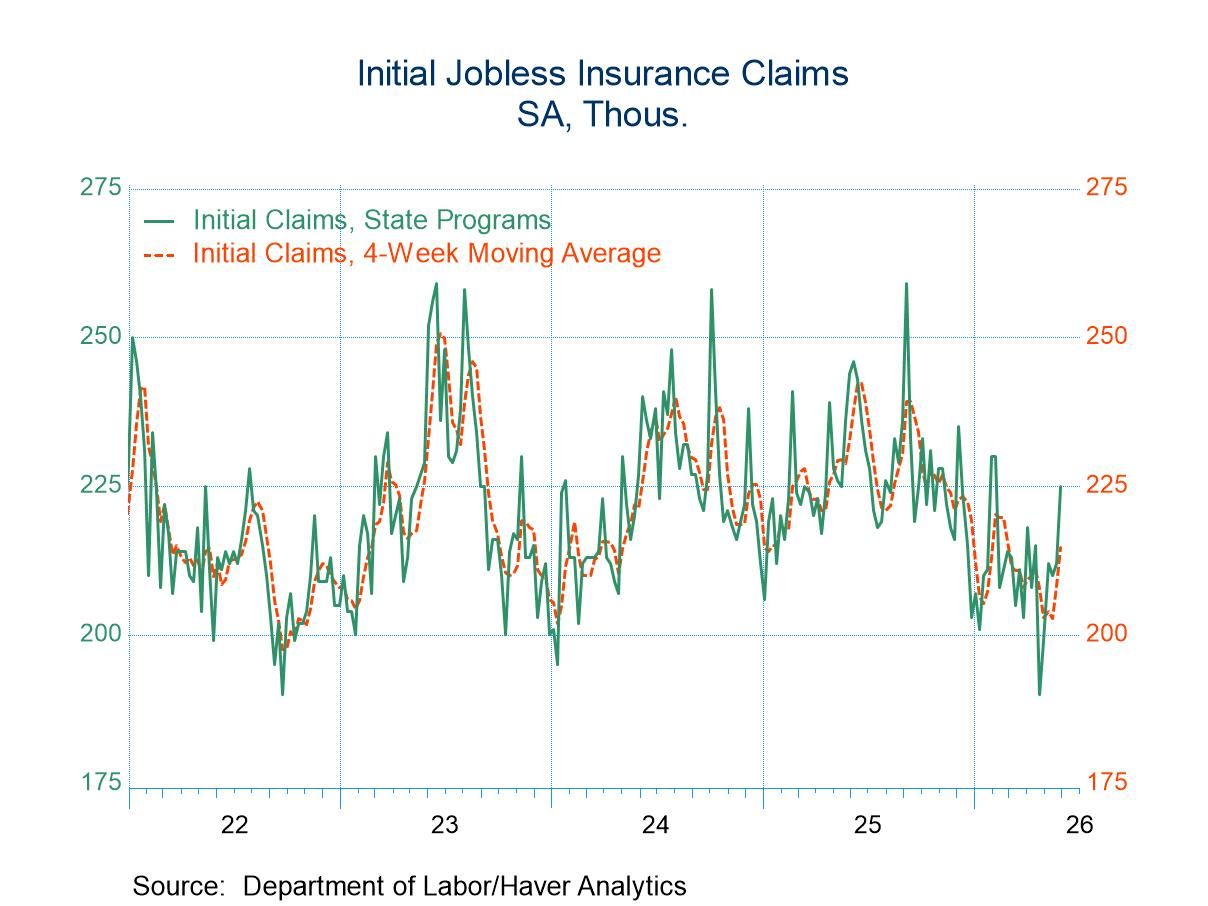
Initial claims for unemployment insurance rose 13,000 to 225,000 in the week ending May 30 from a downwardly revised 212,000 in the prior week (previously 215,000). This was the highest weekly reading since the week ending February 7. The four-week average jumped to 214,750 in the week of May 30 from 208,250 in the previous week. The Action Economics/Haver Analytics Survey looked for 215,000 claims to have been filed.
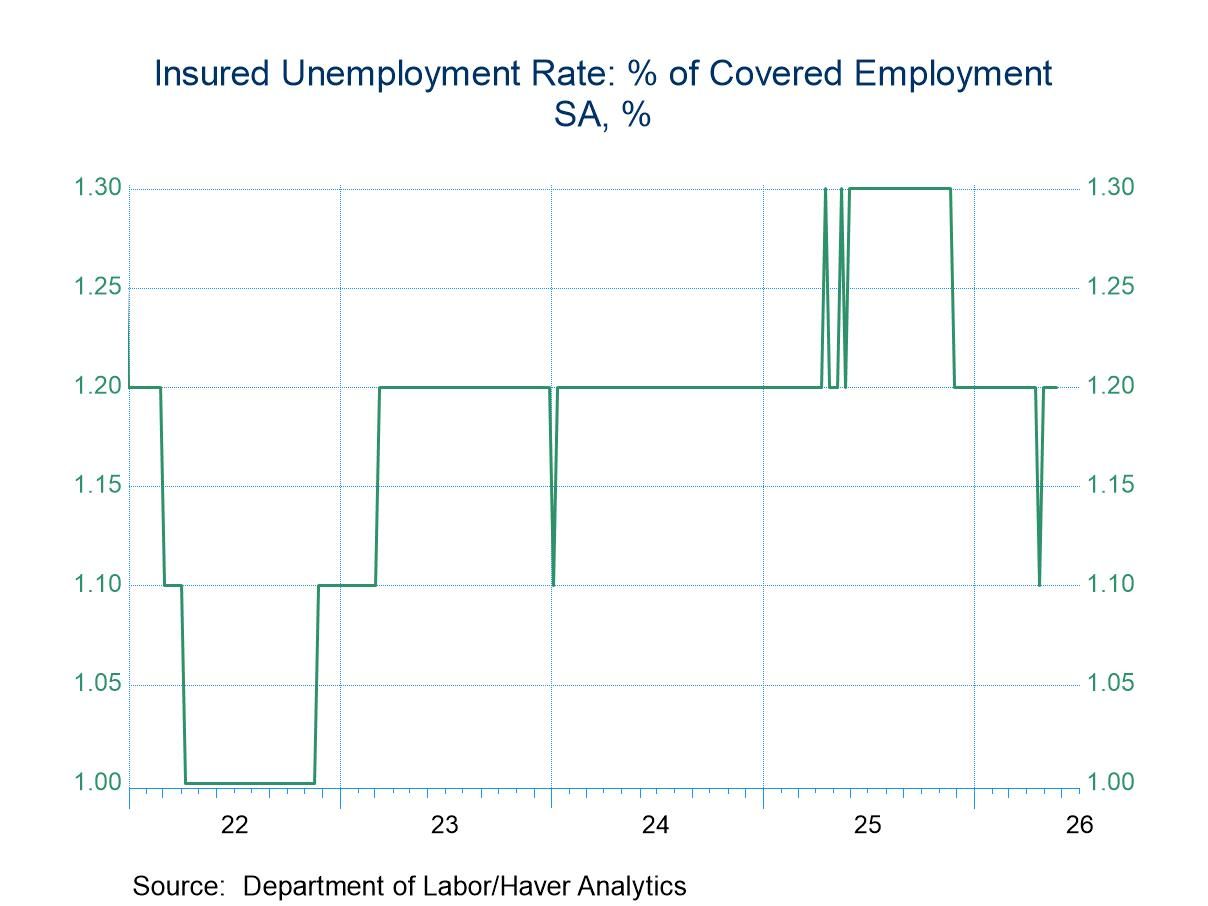
The total number of unemployment insurance beneficiaries—also known as “continuing claims”—fell by 8,000 to 1.777 million in the week ending May 23 from a downwardly revised 1.785 million in the prior week (previously 1.786 million). The four-week average edged up to 1.777 million from 1.773 million. The insured unemployment rate was unchanged at 1.2% for the fourth consecutive week. Except for a one-week dip to 1.1% in the week of April 25, the insured unemployment rate has been at 1.2% since the week of November 29, 2025.
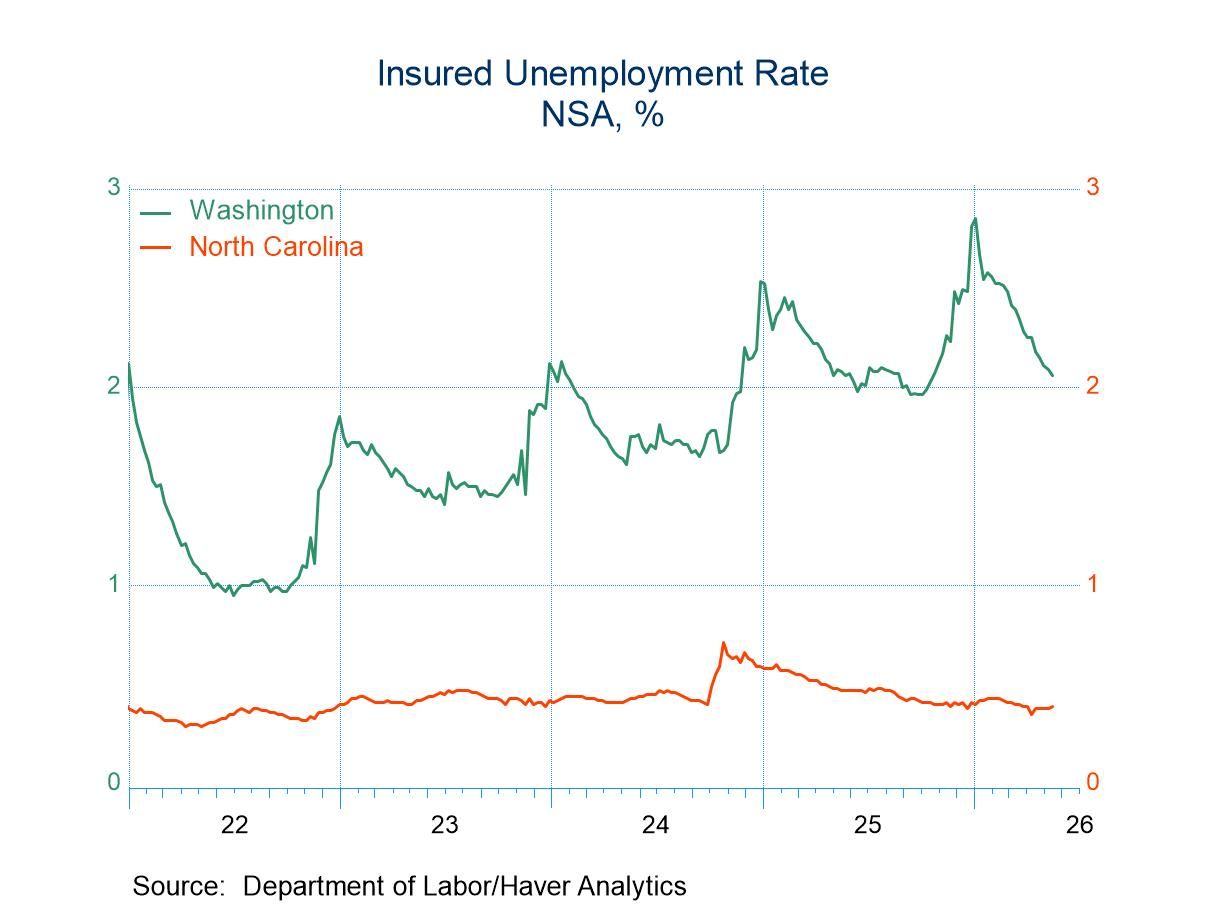
The insured unemployment rate varied greatly across individual states and territories. In the week ending May 16, the highest unemployment rates were in New Jersey (2.08%), Washington (2.06%), Massachusetts (1.92%) and California (1.89%). The lowest rates were in South Dakota (0.26%), Louisiana (0.33%), Florida (0.34%), Alabama (0.38%) and North Carolina (0.39%). Rates in other notable states include New York (1.57%), Illinois (1.47%), Pennsylvania (1.27%), and Texas (1.06%). These state data are not seasonally adjusted.
Data on weekly unemployment claims are from the Department of Labor itself, not the Bureau of Labor Statistics. They begin in 1967 and are contained in Haver’s WEEKLY database and summarized monthly in USECON. Data for individual states are in REGIONW back to December 1986.

Sandy Batten
AuthorMore in Author Profile »Sandy Batten has more than 30 years of experience analyzing industrial economies and financial markets and a wide range of experience across the financial services sector, government, and academia. Before joining Haver Analytics, Sandy was a Vice President and Senior Economist at Citibank; Senior Credit Market Analyst at CDC Investment Management, Managing Director at Bear Stearns, and Executive Director at JPMorgan. In 2008, Sandy was named the most accurate US forecaster by the National Association for Business Economics. He is a member of the New York Forecasters Club, NABE, and the American Economic Association. Prior to his time in the financial services sector, Sandy was a Research Officer at the Federal Reserve Bank of St. Louis, Senior Staff Economist on the President’s Council of Economic Advisors, Deputy Assistant Secretary for Economic Policy at the US Treasury, and Economist at the International Monetary Fund. Sandy has taught economics at St. Louis University, Denison University, and Muskingun College. He has published numerous peer-reviewed articles in a wide range of academic publications. He has a B.A. in economics from the University of Richmond and a M.A. and Ph.D. in economics from The Ohio State University.
More Economy in Brief