

 Global| Sep 09 2026
The End of Painless Disinflation
by:Andrew Cates
|in:Viewpoints
The latest round of inflation releases will help determine what central banks do next. A larger question lies behind the monthly numbers. Has inflation once again become more responsive to economic pressure? For much of the decade after the global financial crisis, falling unemployment generated surprisingly little inflation. That apparent flattening of the Phillips curve, the relationship between economic slack and inflation, encouraged policymakers to believe that economies could run hot at relatively little cost. Evidence since 2020 suggests that assumption is now less secure.
This argument complements, rather than overturns, the analysis in The age of abundance is over. That article argued that today’s inflation overshoot largely reflects scarcer labour, energy and productive capacity, none of which higher interest rates can directly replace. The evidence considered here makes a separate point. Even if supply constraints explain much of the current level of inflation, additional demand may now pass into prices more readily than it did in the 2010s. The source of inflation and its sensitivity to demand are related questions, but they are not the same question.
The evidence from the United States The US provides the clearest example. Comparing a real-time measure of economic tightness with inflation one year later reveals a marked break after 2020. Before then, a one-standard-deviation rise in the tightness measure was associated with an increase of about 0.4 percentage points in subsequent inflation. Since 2020, the estimated response has been roughly four times as large, at about 1.7 percentage points (Figure 1). Put simply, inflation now appears to react more strongly when demand presses against the economy’s capacity.
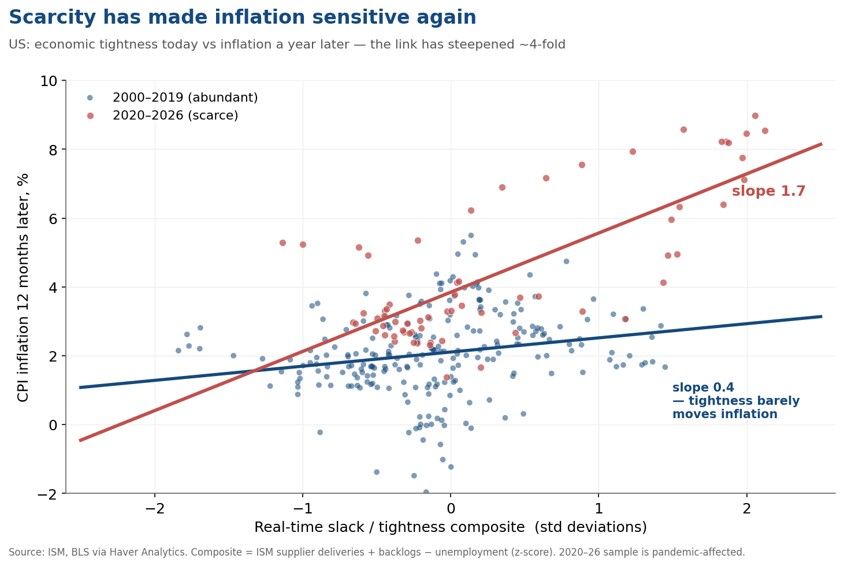
Figure 1. US economic tightness and inflation one year later, before and since 2020. Source: ISM and BLS via Haver Analytics.
This may have contributed to the decline in US CPI inflation from 9.1 per cent in June 2022 to around 3 per cent by mid-2023 without the recession many forecasters had expected. The easing of supply disruption was also crucial. A steeper relationship means that the demand-driven part of inflation can fall materially when economic pressure eases only modestly. It does not mean that supply-driven inflation can be eliminated without significant economic cost.
The relationship has also changed over time. It was comparatively firm during the expansion of the mid-2000s, flattened as spare capacity opened after the financial crisis, and steepened sharply after 2020 (Figure 2). This pattern suggests that the Phillips curve may itself depend on the state of the economy. Inflation responds weakly when capacity is abundant, but more strongly when labour, energy and supply chains are constrained. A sufficiently large downturn could therefore flatten it again.
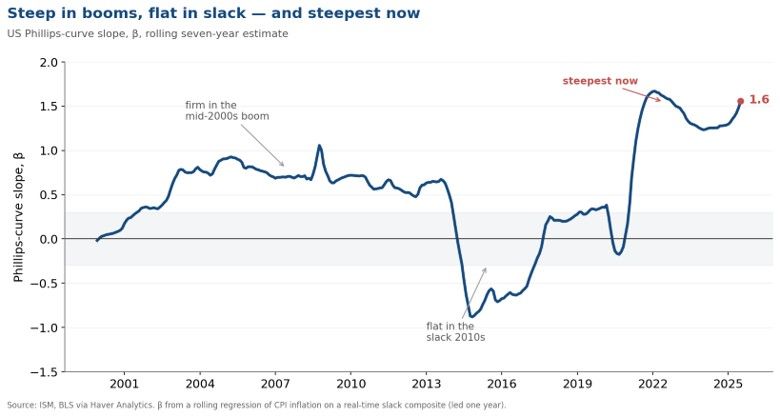
Figure 2. Rolling seven-year estimate of the US response of inflation to economic tightness. Source: ISM and BLS via Haver Analytics.
Evidence beyond America Two objections arise. The first is that the result is peculiar to the US. The second is that it merely captures the pandemic supply shock. Neither explanation is sufficient on its own. Labour-market pressure can be measured using vacancies relative to unemployment, while supply-chain pressure and energy inflation can be controlled for directly. On that basis, inflation has become more responsive to labour-market tightness since 2020 in the US, UK, Japan and Canada (Figure 3). The controls explain a substantial part of the change, confirming the importance of supply disruption, but they do not eliminate it.
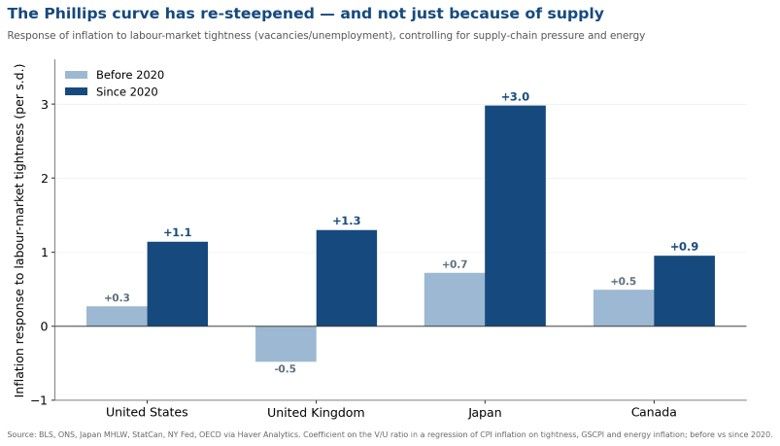
Figure 3. Estimated response of inflation to labour-market tightness, controlling for supply-chain pressure and energy prices. Source: BLS, ONS, Japan MHLW, StatCan, New York Fed and OECD via Haver Analytics.
The estimates should be treated with care. The post-2020 samples are short, and the euro area cannot be included because it lacks a comparable vacancy series. Even so, a similar shift across four different labour markets is harder to dismiss than an isolated US result. It suggests that the forces which kept inflation unusually insensitive to domestic pressure in the 2010s have weakened across much of the advanced world.
Why the relationship changed Scarcity offers a plausible explanation. The global labour supply is no longer expanding as readily, energy has become more expensive and less dependable, and fragmented trade and production networks provide less capacity to absorb an increase in demand. In this environment, extra spending is more likely to encounter a physical constraint and raise prices. Artificial intelligence could eventually expand productive capacity and flatten the relationship again. For now, however, its data centres, electricity requirements and financing needs are adding to demand for scarce resources before the full productivity benefit has appeared.
Implications for monetary policy A steeper Phillips curve restores some potency to demand management, but only against the inflation generated or amplified by excess demand. Higher interest rates cannot produce energy, repair supply chains or expand the workforce. They can prevent supply shocks from being reinforced by excessive spending, wage pressure and rising inflation expectations. This distinction matters when central banks decide how forcefully to respond to an inflation overshoot.
The policy lesson is therefore more demanding than a simple case for tighter money. Central banks have less room than they did in the 2010s to assume that strong employment will have little effect on prices. Yet forcing supply-driven inflation down through weaker demand alone could impose a substantial cost in output and jobs. Policymakers must judge both where an inflation shock originated and whether domestic pressure is propagating it.
The financial-market consequences follow from the same uncertainty, although they are secondary to the policy issue. If inflation responds more strongly to economic pressure, interest-rate expectations are likely to move more sharply with incoming data, and government bonds may provide less reliable protection during inflation shocks. The central conclusion, however, concerns the economy itself. The decline in inflation after 2022 was unusually benign, but it should not be treated as proof that future episodes will be equally painless. In an age of scarcer supply, demand management matters more, while the limits of what it can achieve have become more apparent.
Methodology: US estimates relate CPI inflation one year ahead to a real-time slack measure based on ISM supplier deliveries, order backlogs and unemployment. Cross-country estimates relate CPI inflation to vacancies divided by unemployment, controlling for the New York Fed global supply-chain pressure index and energy inflation. Post-2020 samples are short. Data via Haver Analytics.

Andrew Cates
AuthorMore in Author Profile »Andy Cates joined Haver Analytics as a Senior Economist in 2020. Andy has more than 25 years of experience forecasting the global economic outlook and in assessing the implications for policy settings and financial markets. He has held various senior positions in London in a number of Investment Banks including as Head of Developed Markets Economics at Nomura and as Chief Eurozone Economist at RBS. These followed a spell of 21 years as Senior International Economist at UBS, 5 of which were spent in Singapore. Prior to his time in financial services Andy was a UK economist at HM Treasury in London holding positions in the domestic forecasting and macroeconomic modelling units. He has a BA in Economics from the University of York and an MSc in Economics and Econometrics from the University of Southampton.