Sweden’s Industrial Production Falls in October
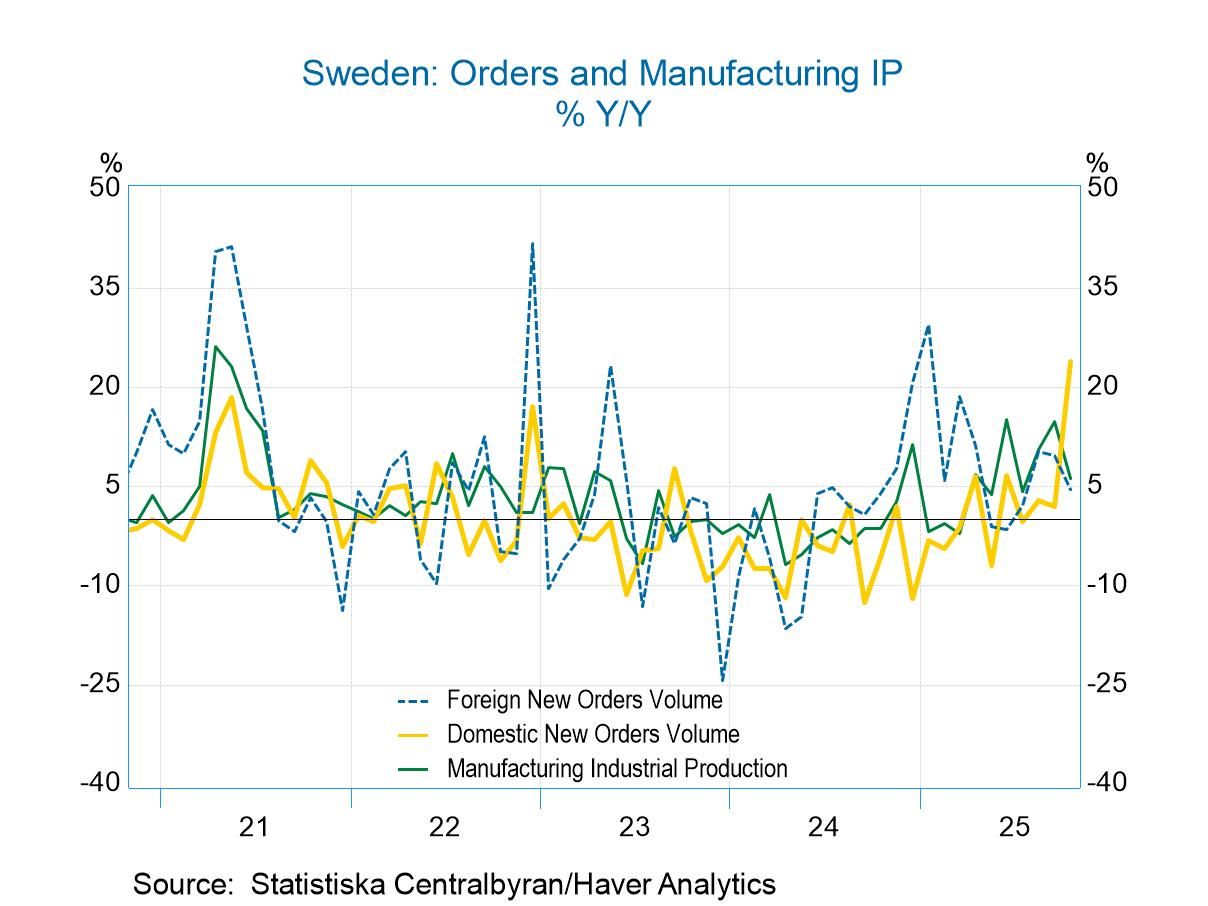
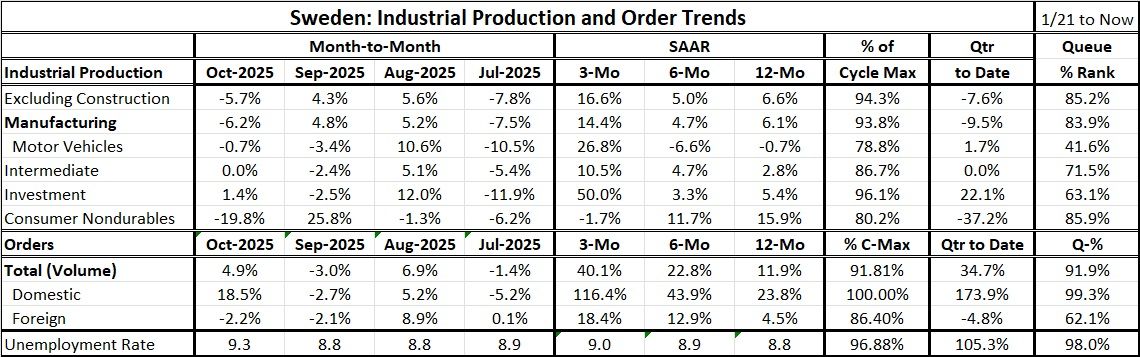
Swedish IP turns up sour in October: Industrial production in Sweden fell 5.7% in October, a relatively large decline, but it comes in a period when industrial production has been unusually volatile. Going back to July, industrial production fell month-to-month by 7.8%, then rose by 5.6% in August, rose again by 4.3% in September, and now fell by 5.7% in October. These month-to-month figures show a great deal of volatility in this series for industrial production excluding construction. The performance for overall manufacturing production is similarly volatile. The components in the table show that vehicle production, intermediate goods production, investment goods production, and the production of consumer nondurables all demonstrate the same kinds of monthly volatility.
Broader sequential growth rates settle down: Turning to sequential growth rates, conditions appeared to settle down to some extent, as industrial production excluding construction rises 6.6% over 12 months, at a slower of 5% annual rate over six months, then hops up to a 16.6% annual rate over three months. Manufacturing demonstrates the same growth slowdown and spurts over 12 months, six months, and three months. So does motor vehicle production, but with even greater extremes in the swings. The production of intermediate goods, on the other hand, shows steady acceleration. The investment goods sector shows growth over 12 months leading to a six-month slowdown and then a super spurt over three months that brings the growth rate to 50% annualized. Consumer nondurables output, on the other hand, shows a consistent slowdown from a 15.9% increase over 12 months to an 11.7% annual rate of increase over six months, to a decline of 1.7% at an annual rate over three months.
All are off their cycle peaks: All industrial production figures are well off of cycle peaks with motor vehicles the farthest off their cycle peak at just under 80% of their cycle peak, a standing similar for consumer nondurables. Overall industrial production excluding construction is only about 6 percentage points below its actual peak.
Quarter-to-date: The quarter to date industrial production excluding construction and the figure for overall manufacturing both showing annual rate declines between 7 and 10% at an annual rate. Motor vehicle production is making a modest recovery with a low single-digit growth rate. Intermediate goods are so far flat in the new quarter, with the investment goods output rising at a 22.1% annual rate and consumer nondurables output falling at a 37.2% annual rate. Once again, we see a great deal of volatility in these figures.
Current growth rate rankings over 24 years: However, taking an historic context, if we confine ourselves to looking at the year-over-year growth rates for Swedish industrial production, we find that overall production excluding construction has the growth rate with an 85.2 percentile standing. Manufacturing has an 84-percentile standing. Intermediate goods have a 71.5 percentile standing, with consumer nondurables having an 86-percentiles standing; investment goods have only a 63% standing. The production of motor vehicles has a 41.6% standing; it is the only category with a growth rate below its historic median.
Industrial order volumes The picture for order volume is volatility by month; however, on a sequential timeline from 12-months to six-months to three-months, order volume is accelerating. Domestic order volume is accelerating at an extremely rapid rate with orders at 23.8% year-over-year, a six-month growth rate of 43.9%, and a three-month growth rate of 116.4% annualized. Foreign orders also experience ongoing acceleration but to a much less extent, running from 4.5% over 12 months, to a 12.9% annual rate over six months, up to an 18.4% annualized pace over three months.
QTD and % of cycle highlights: Not surprisingly the orders growth rate is at a cycle high for domestic orders; the quarter-to-date total orders and domestic order growth are running at extremely strong rates. Foreign orders growth is at a negative 4.8% annualized for the first month in the new quarter.
Rankings: The ranking of the year-over-year growth rates finds total order volume at a 91.9% standing, domestic orders at a 99.3% standing, and foreign orders at a 62.1% standing, all of them above their historic medians by a wide margin.
Memo: Unemployment For comparison, we include the unemployment rate at the bottom of this table, and we see that Swedish unemployment continues to hover at an exceptionally high level. Ranked on data back to January 2021, the unemployment rate is at its top 2%. In fact, the October unemployment rate is the sixth highest monthly rate on this timeline. Despite what appears to be solid and even strong performance by the industrial sector, Swedish unemployment continues to linger at a level that is historically high for Sweden.

Robert Brusca
AuthorMore in Author Profile »Robert A. Brusca is Chief Economist of Fact and Opinion Economics, a consulting firm he founded in Manhattan. He has been an economist on Wall Street for over 25 years. He has visited central banking and large institutional clients in over 30 countries in his career as an economist. Mr. Brusca was a Divisional Research Chief at the Federal Reserve Bank of NY (Chief of the International Financial markets Division), a Fed Watcher at Irving Trust and Chief Economist at Nikko Securities International. He is widely quoted and appears in various media. Mr. Brusca holds an MA and Ph.D. in economics from Michigan State University and a BA in Economics from the University of Michigan. His research pursues his strong interests in non aligned policy economics as well as international economics. FAO Economics’ research targets investors to assist them in making better investment decisions in stocks, bonds and in a variety of international assets. The company does not manage money and has no conflicts in giving economic advice.
More Economy in Brief


 Global