Productivity Growth: Downward Revision in Q4
Summary
- Productivity growth was a percentage point slower than previously believed, but still respectable.
- A notable upward revision in unit labor cost is more concerning.
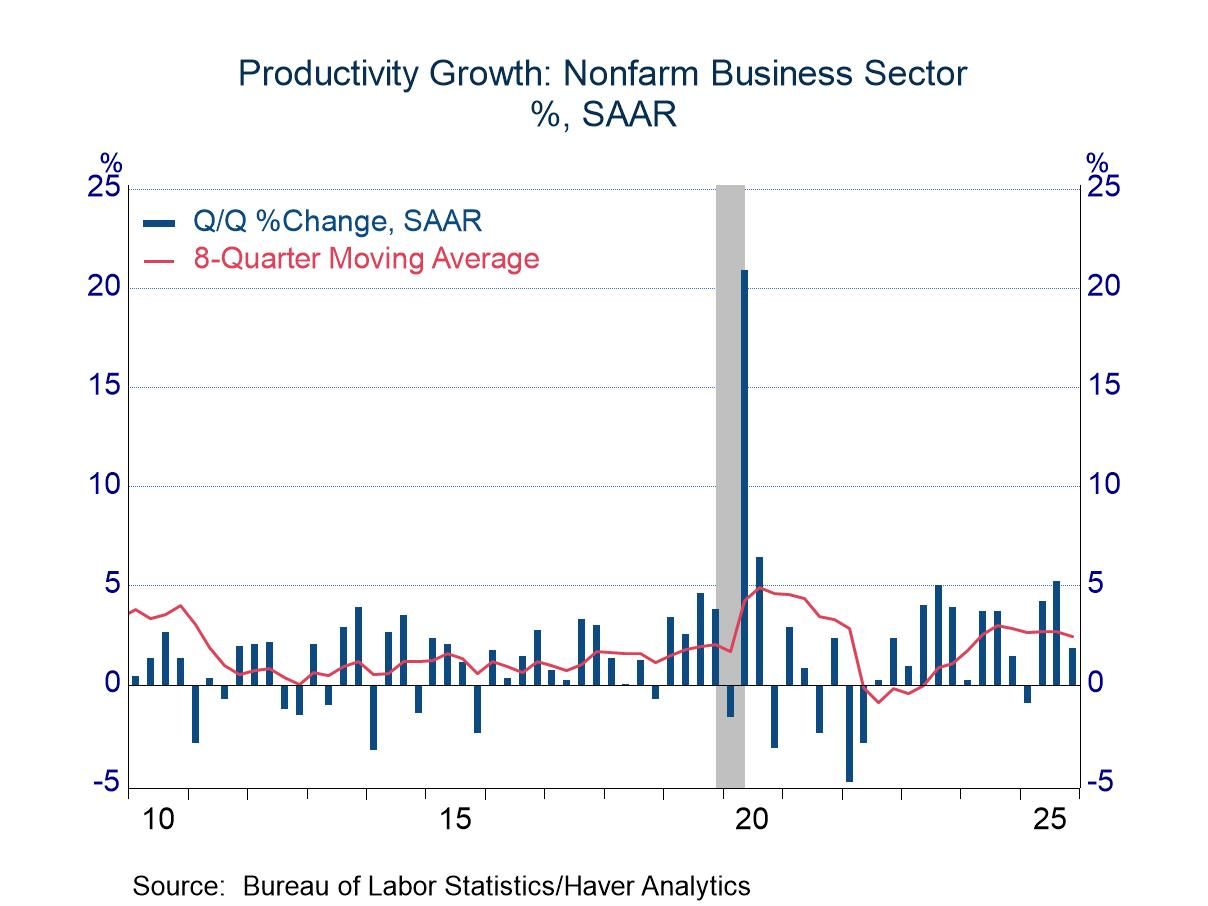
Productivity growth in the nonfarm business sector totaled 1.8% in the fourth quarter of 2025, a full percentage point slower than the preliminary estimate. The adjustment reflected a downward revision to output growth (1.5% versus 2.6%) and no change in the preliminary estimate of hours worked, which dipped 0.2%.
The downward revision was disappointing, but the advance of 1.8% remained comfortably within the range of recent observations. In addition, productivity growth shows considerable variation from quarter-to-quarter, and thus heavy weight should not be placed on any single observation. A moving average provides the best perspective on underlying trends, and even a four-quarter average shows considerable volatility; stable patterns start to become visible with eight-quarter averages. The latest read on the long-term average totaled 2.4% in Q4, noticeably better than observations ranging from fractional gains to 2.0% in the decade before the pandemic (note the red line in the chart above).
The latest eight-quarter average lags the solid gains in 2010 (growth of more than 4.0%). However, this performance followed the recession in 2008-09, and productivity typically grows quickly after recessions. (Businesses return to optimal levels of production, and recessions often motivate new production methods and business models that boost efficiency).
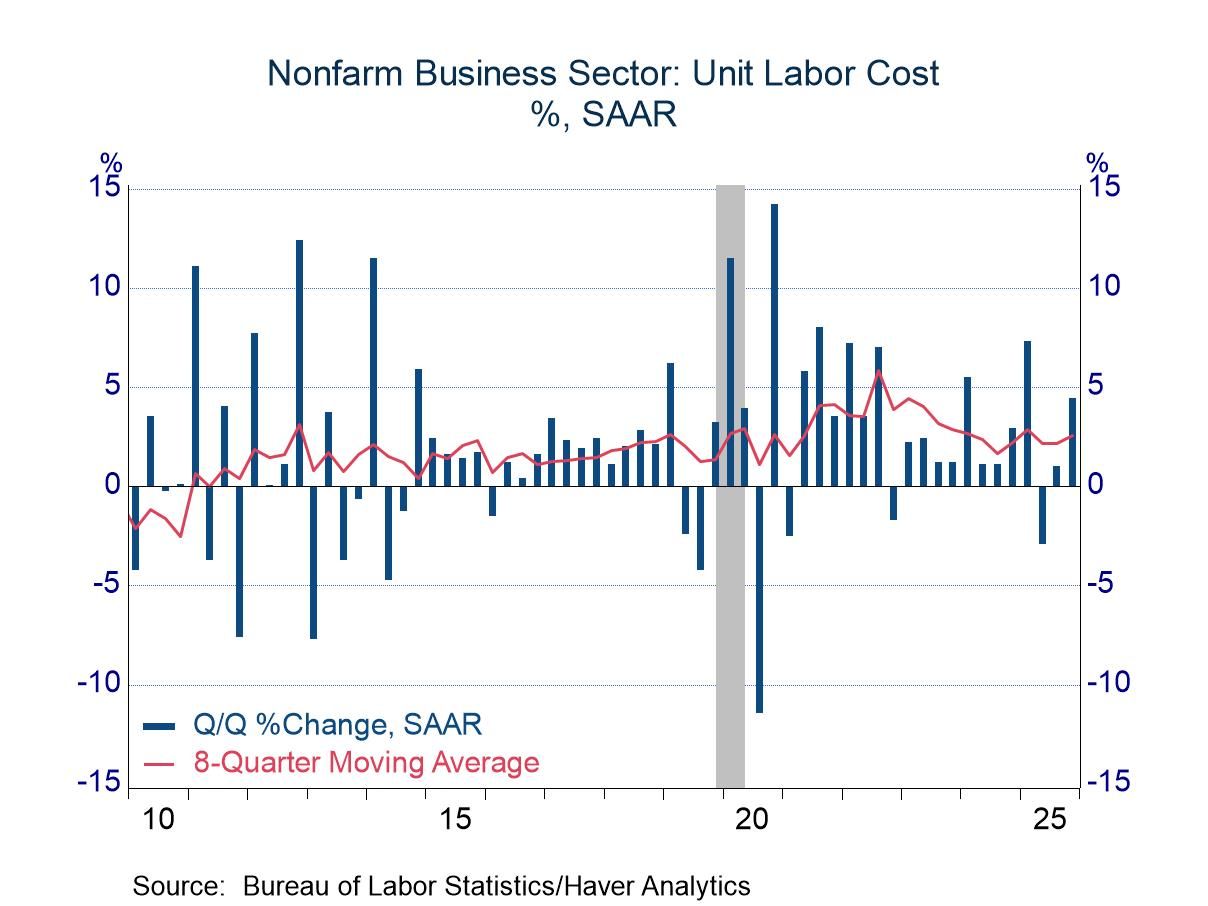
The results for unit labor costs were more disappointing than those for productivity, as labor costs were revised 1.6 percentage points higher to 4.4 percent. In addition to the downward revision to productivity growth, the shift in unit labor costs was influenced by an upward revision of 0.6 percentage point to compensation per hour (now showing growth of 6.3%). A moving average also provides the best perspective on unit labor costs, and the latest observation of 2.5% is uncomfortable relative to the Federal Reserve’s inflation target of 2.0%.
The productivity and labor cost data are available in Haver’s USECON database. The Action Economics expectations figures are in the AS1REPNA database.

Michael J. Moran
AuthorMore in Author Profile »Before joining Haver Analytics in 2025, Michael J. Moran was the chief economist of Daiwa Capital Markets America Inc. He was responsible for preparing the firm’s economic forecast and interest rate outlook. He traveled frequently to visit the clients of Daiwa Capital Markets and wrote weekly economic commentary. Mr. Moran also was involved in the flux of financial markets, as he spent a portion of each day on Daiwa’s trading floor interpreting economic statistics and Federal Reserve activity for traders and salespeople. Mr. Moran is quoted frequently in the financial press, and he appears regularly on cable news shows. He also has published articles in several journals and periodicals. Before joining Daiwa Capital Markets America, Mr. Moran worked as an economist at the Federal Reserve Board in Washington, D.C. where he analyzed a broad range of issues dealing with the financial sector of the economy and regularly briefed the Board of Governors. He was on the faculty of Pennsylvania State University from 1979 to 1980 and taught on a part-time basis at George Washington University from 1980 to 1987.
Mr. Moran received his Ph.D. in economics from Pennsylvania State University in 1980 and a B.S. in business administration from the University of Bridgeport in 1975. He was a CFA charter holder from 2002 until 2016.
More Economy in Brief
 Asia
Asia

