October Employment Report: Firm in Most Respects
Summary
- Payrolls posted a solid gain; Aug/Sep revised upward.
- Headline unemployment edged lower, although broad unemployment rose.
- Average hourly earnings exceeded expectations.
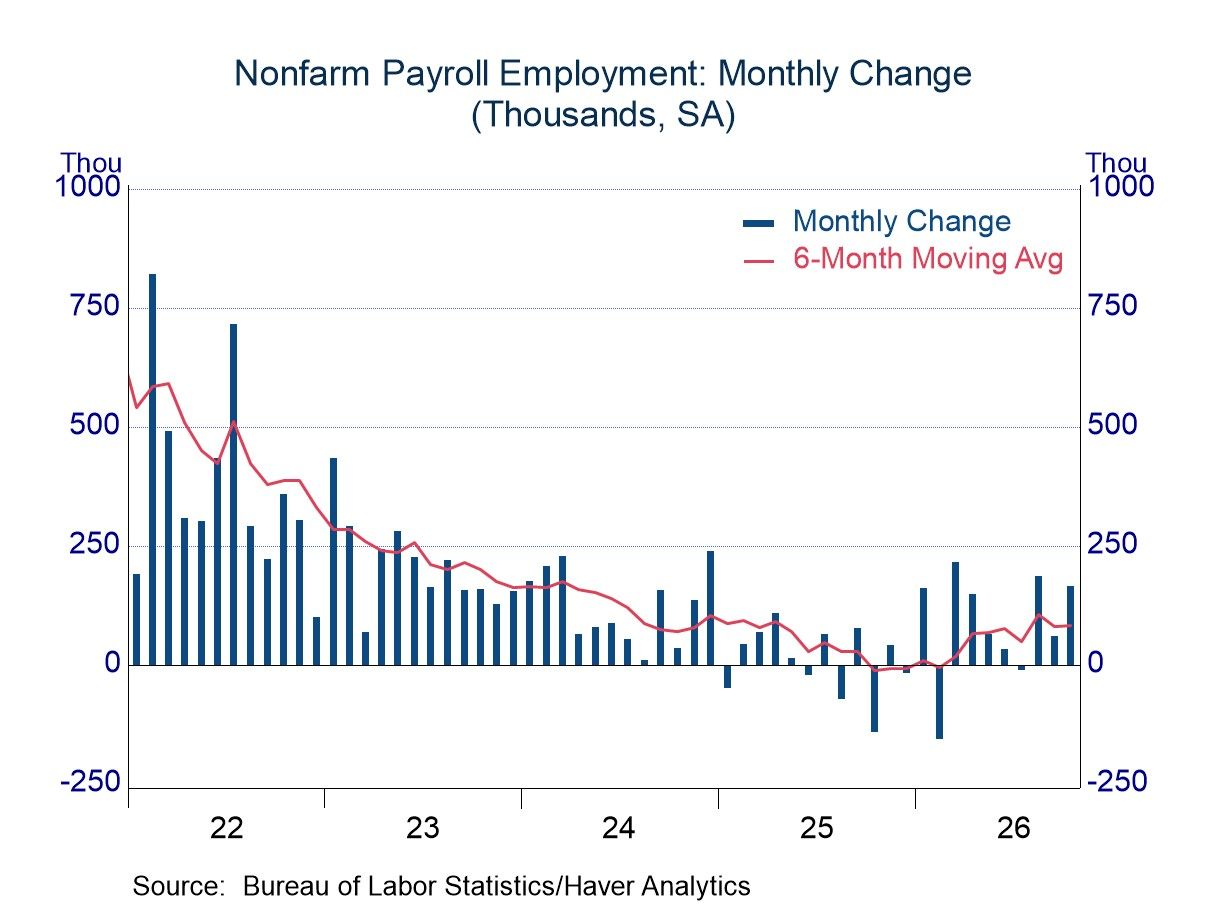
Nonfarm payrolls rose 165K in October, marking one of the best readings of the past few years and easily beating the expected increase of 65K. Moreover, the results in August and September were revised upward by a combined total of 84K. The new figures left the six-month average at 82K, a far better performance than the average monthly increase of only 10K in all of 2025.
Several sectors stood out on the strong side of job growth. Employment in the business-service category jumped 70K, the strongest showing since mid-2022, when the economy was still experiencing the post-Covid boom. In addition, business services contributed importantly to the upward revisions in August and September (an additional 52K jobs). Manufacturing industries are showing signs of life, as they posted their fifth consecutive monthly gain (up 19K) and added 10K to the revisions total. The health-care sector, a reliable area for job growth, had posted below-average results in the prior five months, but the gain of 55K in October brought it close to its long-run average.
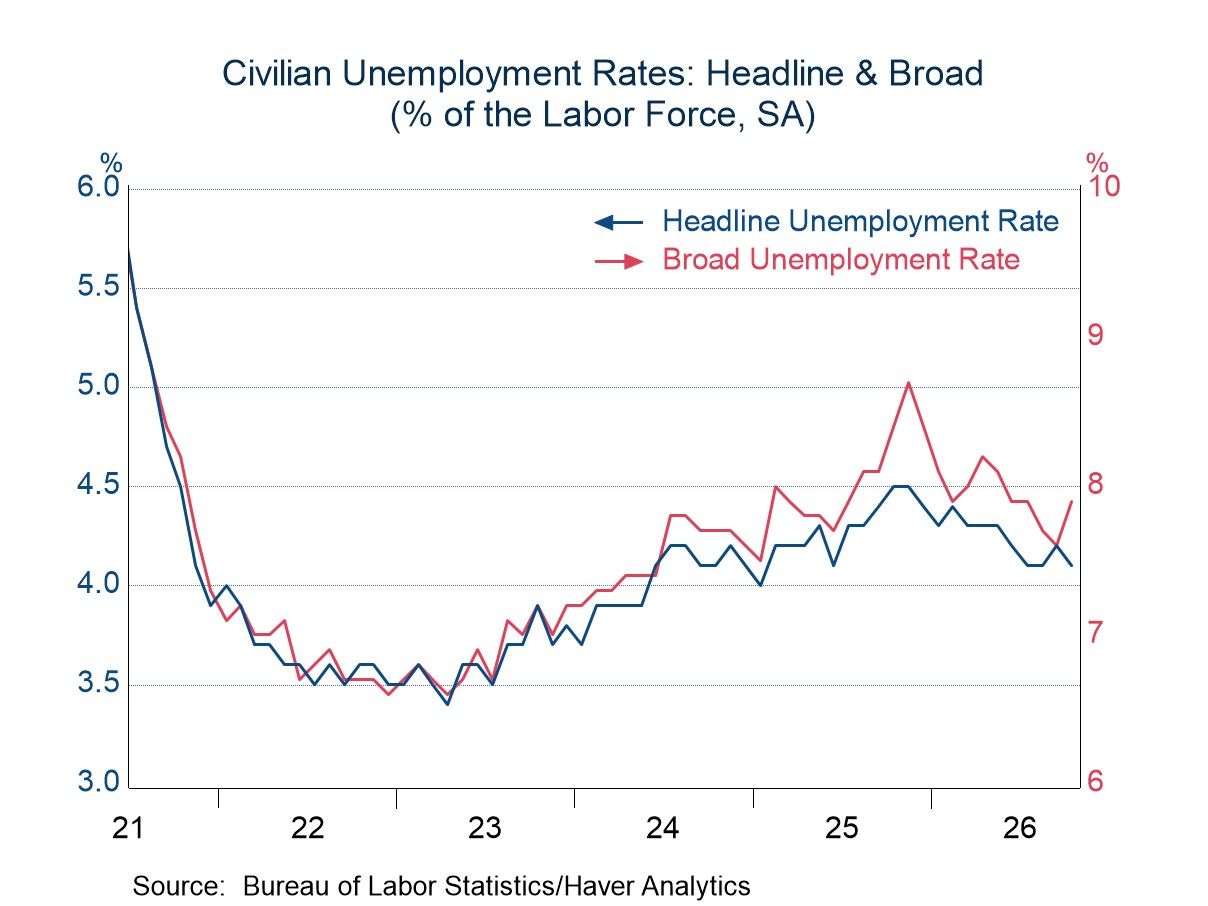
The headline unemployment rate dipped 0.1 percentage point to 4.1%, a reading comfortably within the range of 4.0-4.5% seen in the past two years (although above readings in the neighborhood of 3.5% in the latter part of 2022 and the early months of 2023). It was a “strong” drop in unemployment in the sense that job growth as measured by the household survey exceeded the increase in the size of the labor force (463K versus 421K). October marked the third consecutive month of strong gains for employment and the labor force in the household survey, ending a string of eight months of generally negative results.
Although the headline unemployment rate eased in October, the broad unemployment rate (the so-called U-6 measure) rose 0.3 percentage point to 7.9%. This measure includes individuals working part-time involuntarily and individuals who would like a job and have searched for employment in the past 12 months but have not looked in the past four weeks. Both of these metrics rose in October, contributing to the increase in broad unemployment. The jump in the U-6 measure reversed a good portion of the noticeable improvement since late last year.
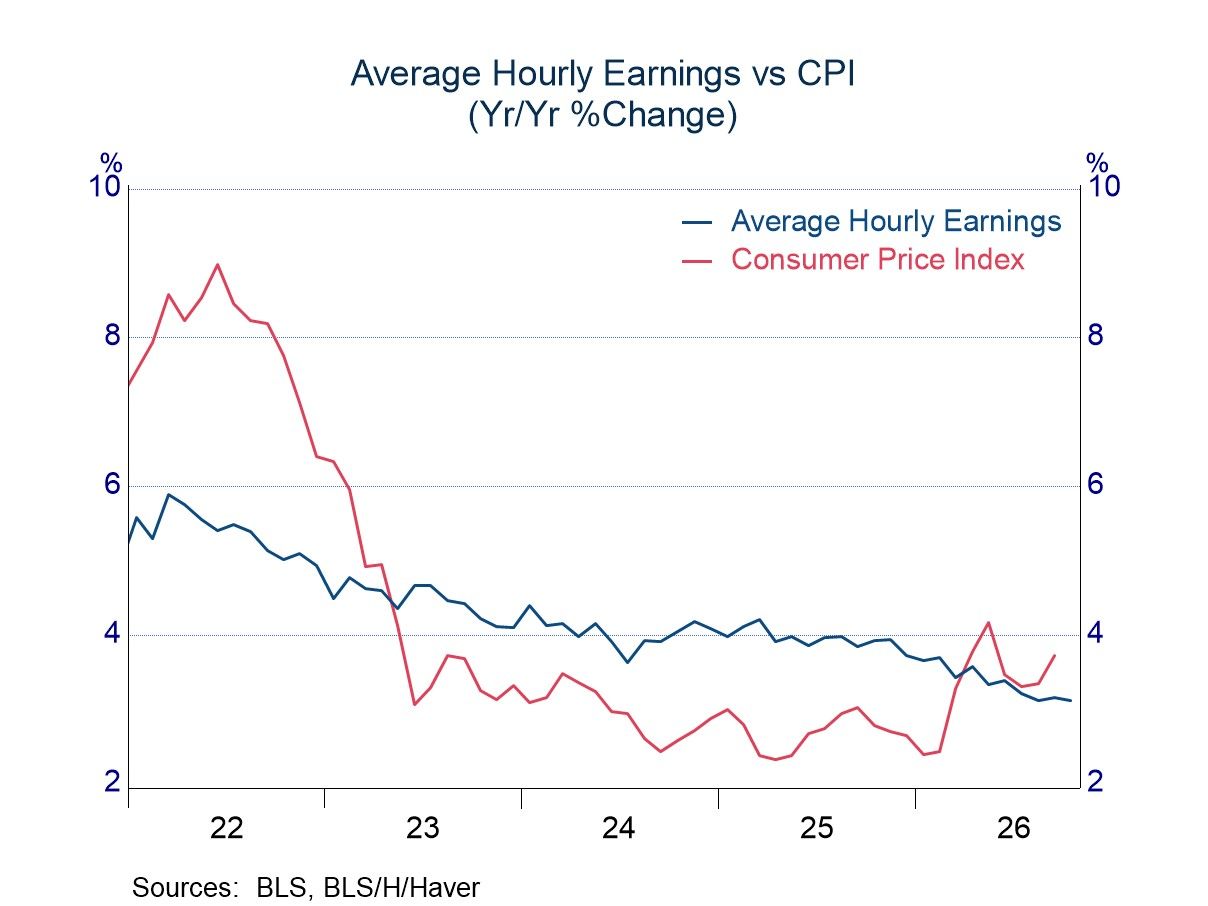
Average hourly earnings rose 0.4% in October, matching the firmest increase of the year thus far. The latest results left the year-over-year change at 3.1%, about equal to the readings in the prior two months, suggesting that the downward trend in wage growth may be starting to stabilize.
The surge in energy prices this year has pushed CPI inflation above the annual increase in average hourly earnings, leaving a drop in aggregate real wage income. However, the financial position of the typical wage earner is difficult to assess because the recent period of negative real wage growth followed several years of real gains, which followed sharp real declines during the inflation burst in 2021-22. The ups and downs over the past several years have been largely offsetting, but individuals in total have registered real wage gains. Still, the surge in prices this year has been sharp enough to generate strains for many households. The strains certainly seem to have had an influence on the midterm elections.
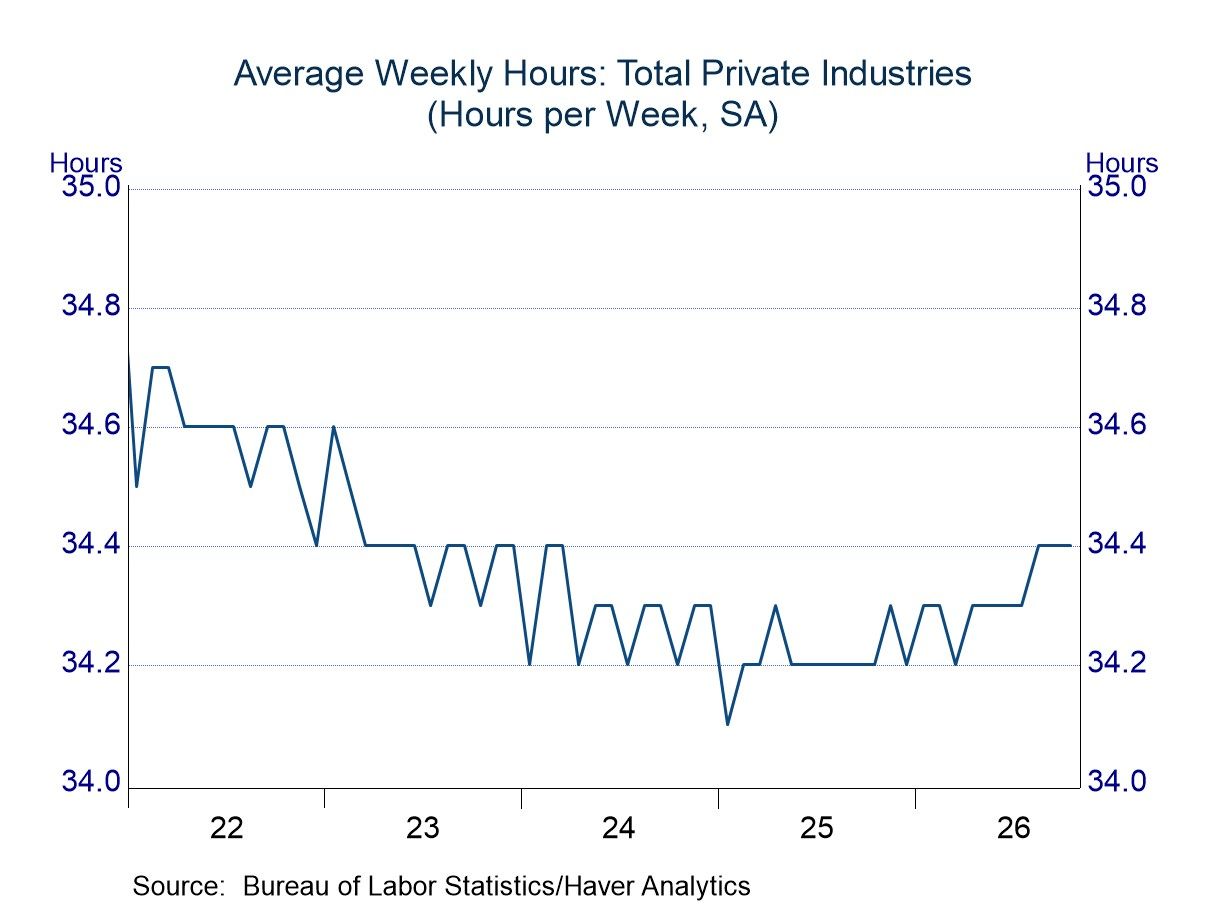
The average workweek is an underappreciated element of the monthly employment report; it receives little attention in the financial press and is not scrutinized by financial market participants. However, it is an important indicator. The current workforce comprises more than 159 million individuals, and thus a change of just a few tenths of an hour can have a noticeable effect on production. The average workweek remained at 34.4 hours for the third consecutive month in October, a better showing than readings of 34.2 to 34.3 in the prior two years or so.
The employment and earnings data are collected from surveys taken each month during the week containing the 12th day of the month. The labor market data are contained in Haver's USECON database. Detailed figures are in the EMPL and LABOR databases. The expectations figures are in the AS1REPNA database.

Michael J. Moran
AuthorMore in Author Profile »Before joining Haver Analytics in 2025, Michael J. Moran was the chief economist of Daiwa Capital Markets America Inc. He was responsible for preparing the firm’s economic forecast and interest rate outlook. He traveled frequently to visit the clients of Daiwa Capital Markets and wrote weekly economic commentary. Mr. Moran also was involved in the flux of financial markets, as he spent a portion of each day on Daiwa’s trading floor interpreting economic statistics and Federal Reserve activity for traders and salespeople. Mr. Moran is quoted frequently in the financial press, and he appears regularly on cable news shows. He also has published articles in several journals and periodicals. Before joining Daiwa Capital Markets America, Mr. Moran worked as an economist at the Federal Reserve Board in Washington, D.C. where he analyzed a broad range of issues dealing with the financial sector of the economy and regularly briefed the Board of Governors. He was on the faculty of Pennsylvania State University from 1979 to 1980 and taught on a part-time basis at George Washington University from 1980 to 1987.
Mr. Moran received his Ph.D. in economics from Pennsylvania State University in 1980 and a B.S. in business administration from the University of Bridgeport in 1975. He was a CFA charter holder from 2002 until 2016.
More Economy in Brief
 Global