Global| Nov 05 2026
Charts of the Week: When Expectations Meet Reality
by:Andrew Cates
|in:Economy in Brief
Summary
The US midterm elections have significantly altered the political landscape in Washington. Democrats have secured control of both houses of Congress, ending unified Republican control and introducing a period of divided government for the remainder of President Trump's term. Concerns about living costs and the war with Iran appear to have influenced voting patterns, contributing to Democratic gains that exceeded expectations. The economic implications are arguably mixed. Divided government could limit the scope for further tax cuts and additional public spending, but may also complicate negotiations over budgets and federal borrowing. The election arrives at an awkward moment for markets. Confidence in the AI investment boom has already been shaken by doubts over financing, valuations and eventual returns. Greater scrutiny of data centres and energy demand adds another uncertainty, but politics did not create the underlying problem. Nor is technology the only source of unease. This week's charts show forecasters struggling to keep pace with changing interest-rate expectations (chart 1), a Korean equity market at odds with increasingly optimistic growth projections (chart 2), and a marked retreat in US loan demand (chart 3). Yet lending to non-bank financial institutions continues to expand (chart 4), supply pressures are reappearing (chart 5), and stretched public finances are unsettling sovereign bond markets (chart 6). The common theme is a world economy whose apparent resilience conceals growing imbalances — and markets that may be recognising them before forecasters do.
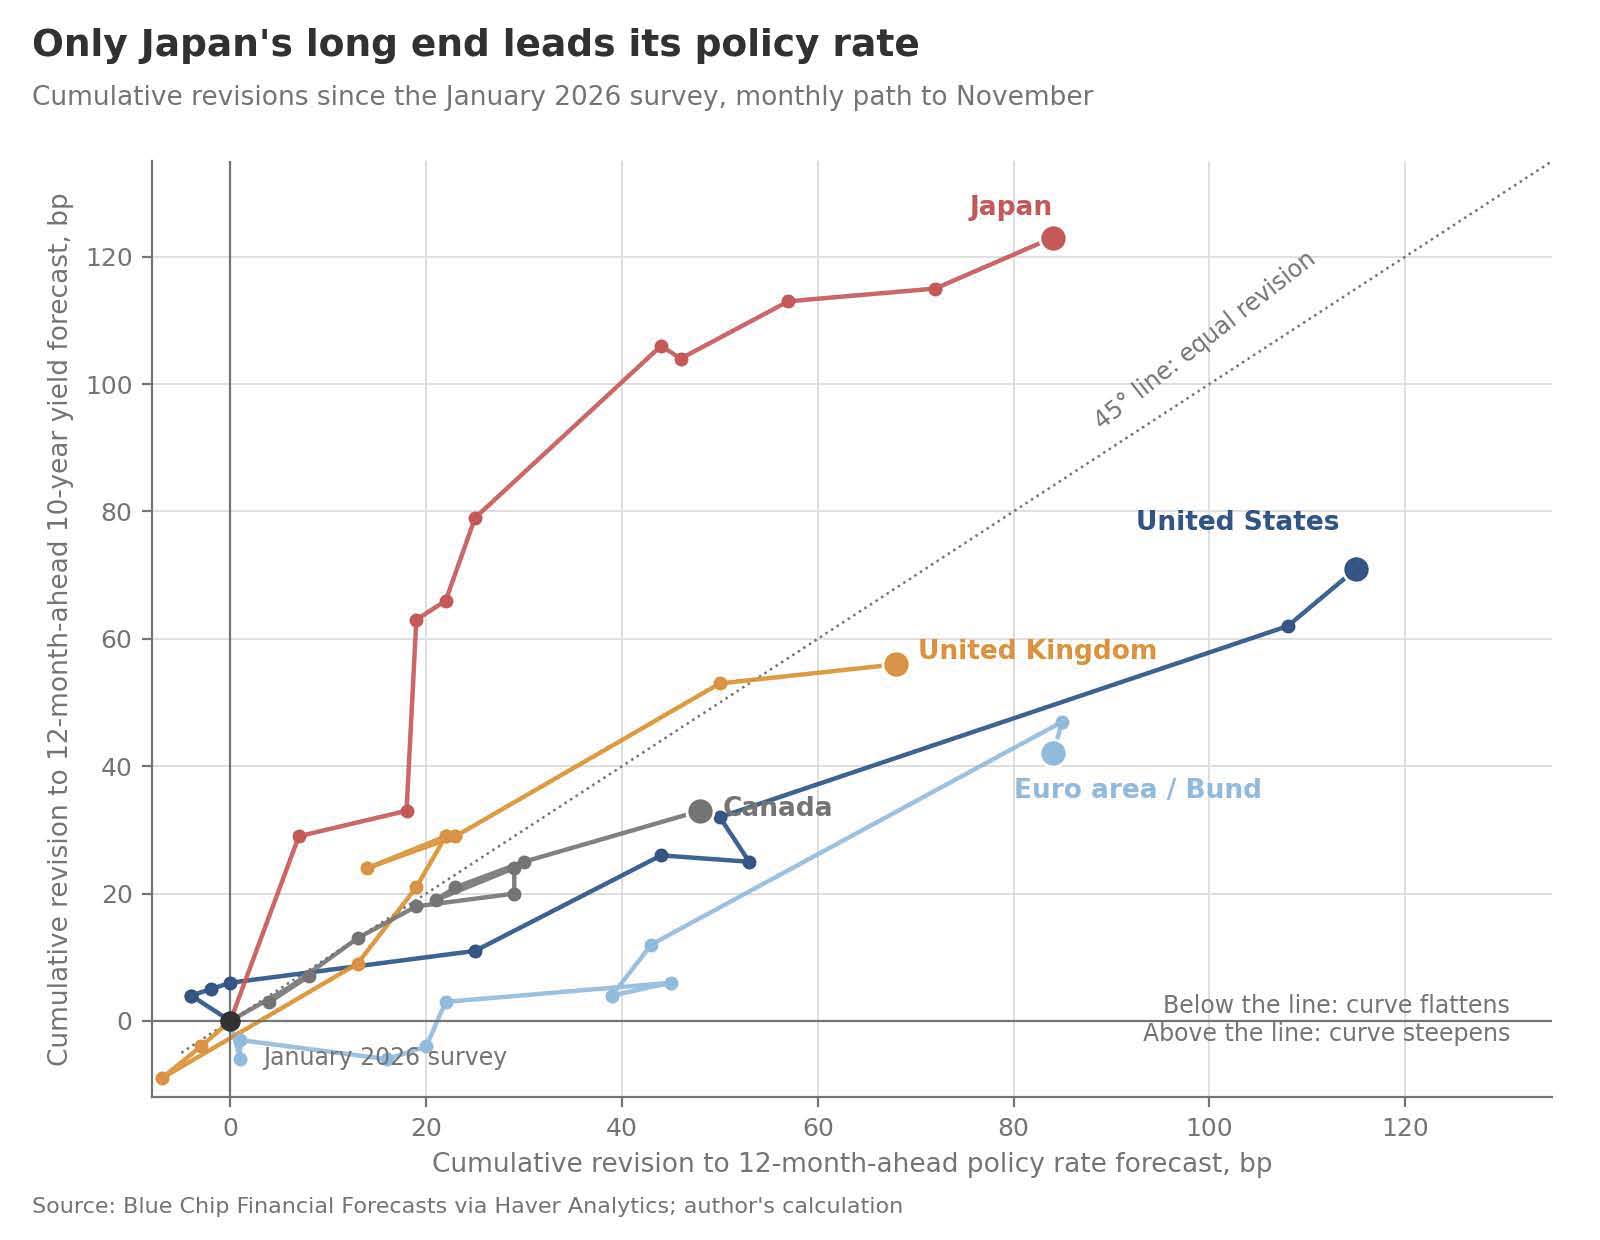
Half a pass-through Interest-rate expectations have moved higher this year, but long-term bond-yield forecasts have risen by much less. The Blue Chip Financial Forecasts panel has repeatedly revised its policy-rate outlook upwards, reflecting a more restrictive monetary environment, while making more modest adjustments to longer-term yields (chart 1). This divergence might suggest that forecasters expect tighter monetary policy to prove less persistent than current interest-rate settings imply, or that other forces are impacting longer-term yields. Japan provides an important contrast. There, long-term yield forecasts have risen more sharply than policy-rate expectations, reflecting growing concerns about government borrowing and fiscal sustainability. The broader message is that bond markets are responding not only to the outlook for monetary policy, but also to differences in fiscal conditions and the credibility of public finances.
Chart 1: Cumulative revisions to 12-month-ahead policy rate and 10-year yield forecasts since January 2026
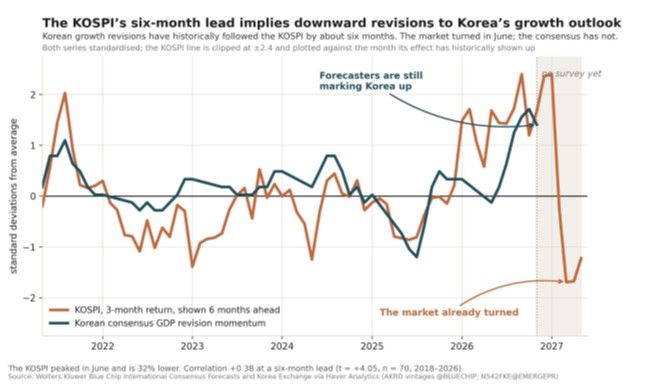
The market has already voted South Korea offers a striking example of the gap between market prices and economic forecasts. The KOSPI has fallen sharply since its June peak, yet consensus growth projections have continued to improve (chart 2). Korea's position at the heart of the global semiconductor supply chain makes it especially sensitive to changes in expectations for AI spending. Its equity market may be signalling a turn in the investment cycle that forecasters have yet to acknowledge. Equities are imperfect predictors, of course, and a correction need not foreshadow an economic downturn. But the divergence may now be too large to dismiss.
Chart 2: Korean consensus growth revision momentum against the KOSPI, shown six months ahead
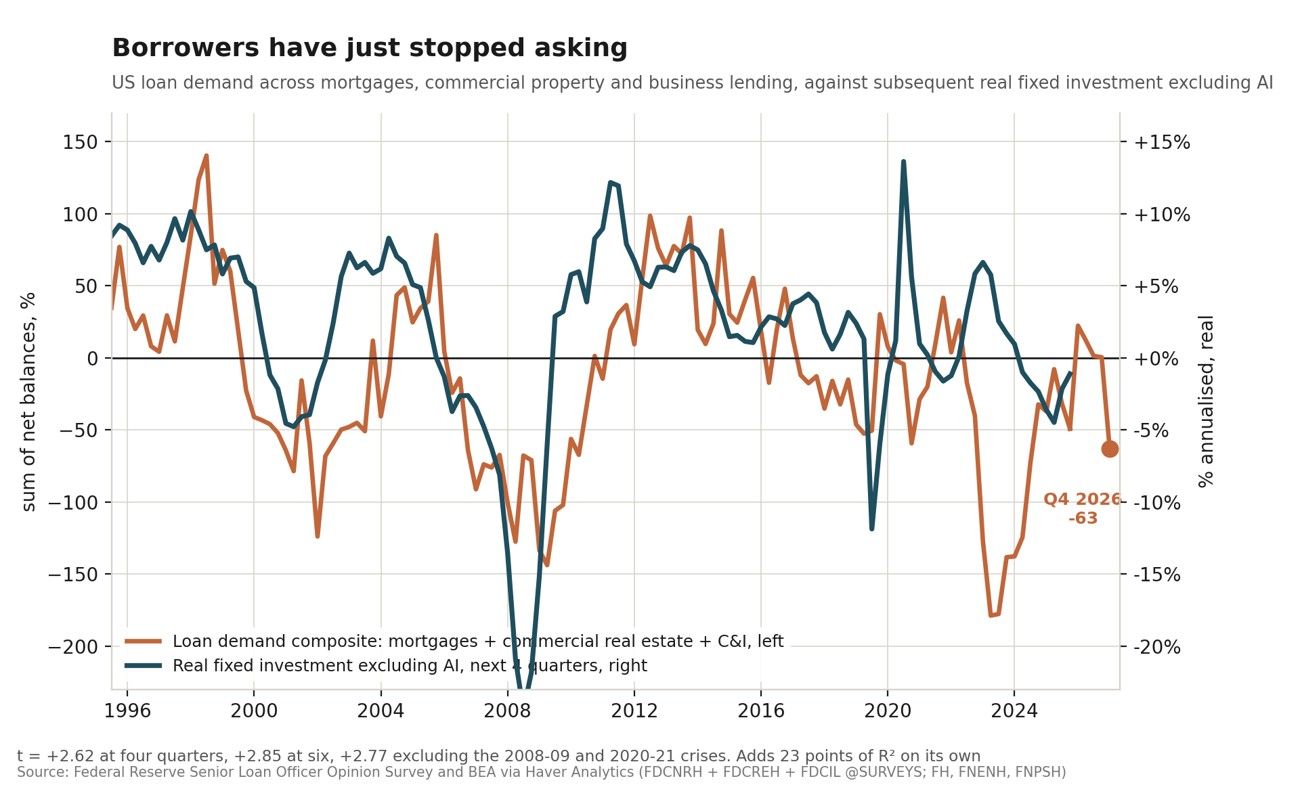
Borrowers have stopped asking The latest Federal Reserve loan officer survey published this week offers a less reassuring view of the American economy. Demand for mortgages, commercial property loans and broader business credit has weakened sharply and together (chart 3). That matters because conventional (i.e. non-AI-related) investment has already been lacklustre. Large-scale technology construction may be sustaining aggregate capital spending, but it does not mean the wider private sector is eager to expand. Monetary policy could already be restraining the borrowers it reaches most directly, even as the most conspicuous investment boom continues elsewhere. This is an uncomfortable imbalance for the Fed — and a warning against treating strong headline investment as evidence of broad-based strength.
Chart 3: US loan demand composite and subsequent real fixed investment excluding AI
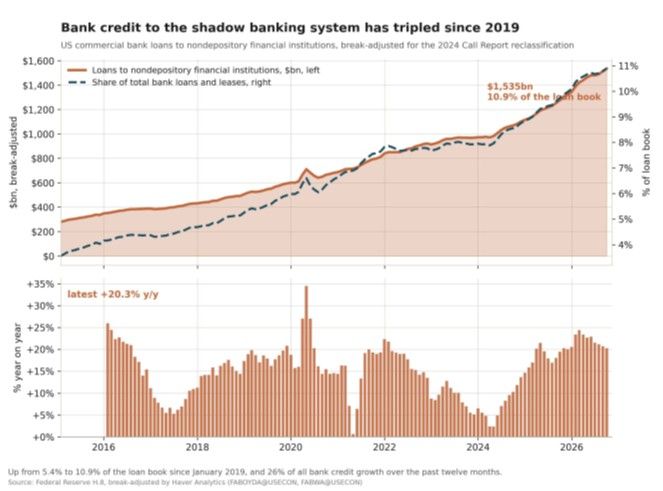
Where the credit is going instead US credit has not disappeared. It has increasingly changed its route. US banks have expanded lending to non-bank financial institutions at a remarkable pace in recent months, and such loans now account for a much larger share of bank balance sheets than they did before the pandemic (chart 4). Some of that money ultimately supports borrowers through private funds and other intermediaries, making the final destination of credit harder to trace. The IMF has also drawn attention to complex financing arrangements within the technology sector. None of this proves that AI investment is chiefly funded through these channels. It does hint that conventional bank-loan data provide an incomplete picture of leverage and risk. A less visible credit cycle is not necessarily a safer one.
Chart 4: US bank lending to nondepository financial institutions
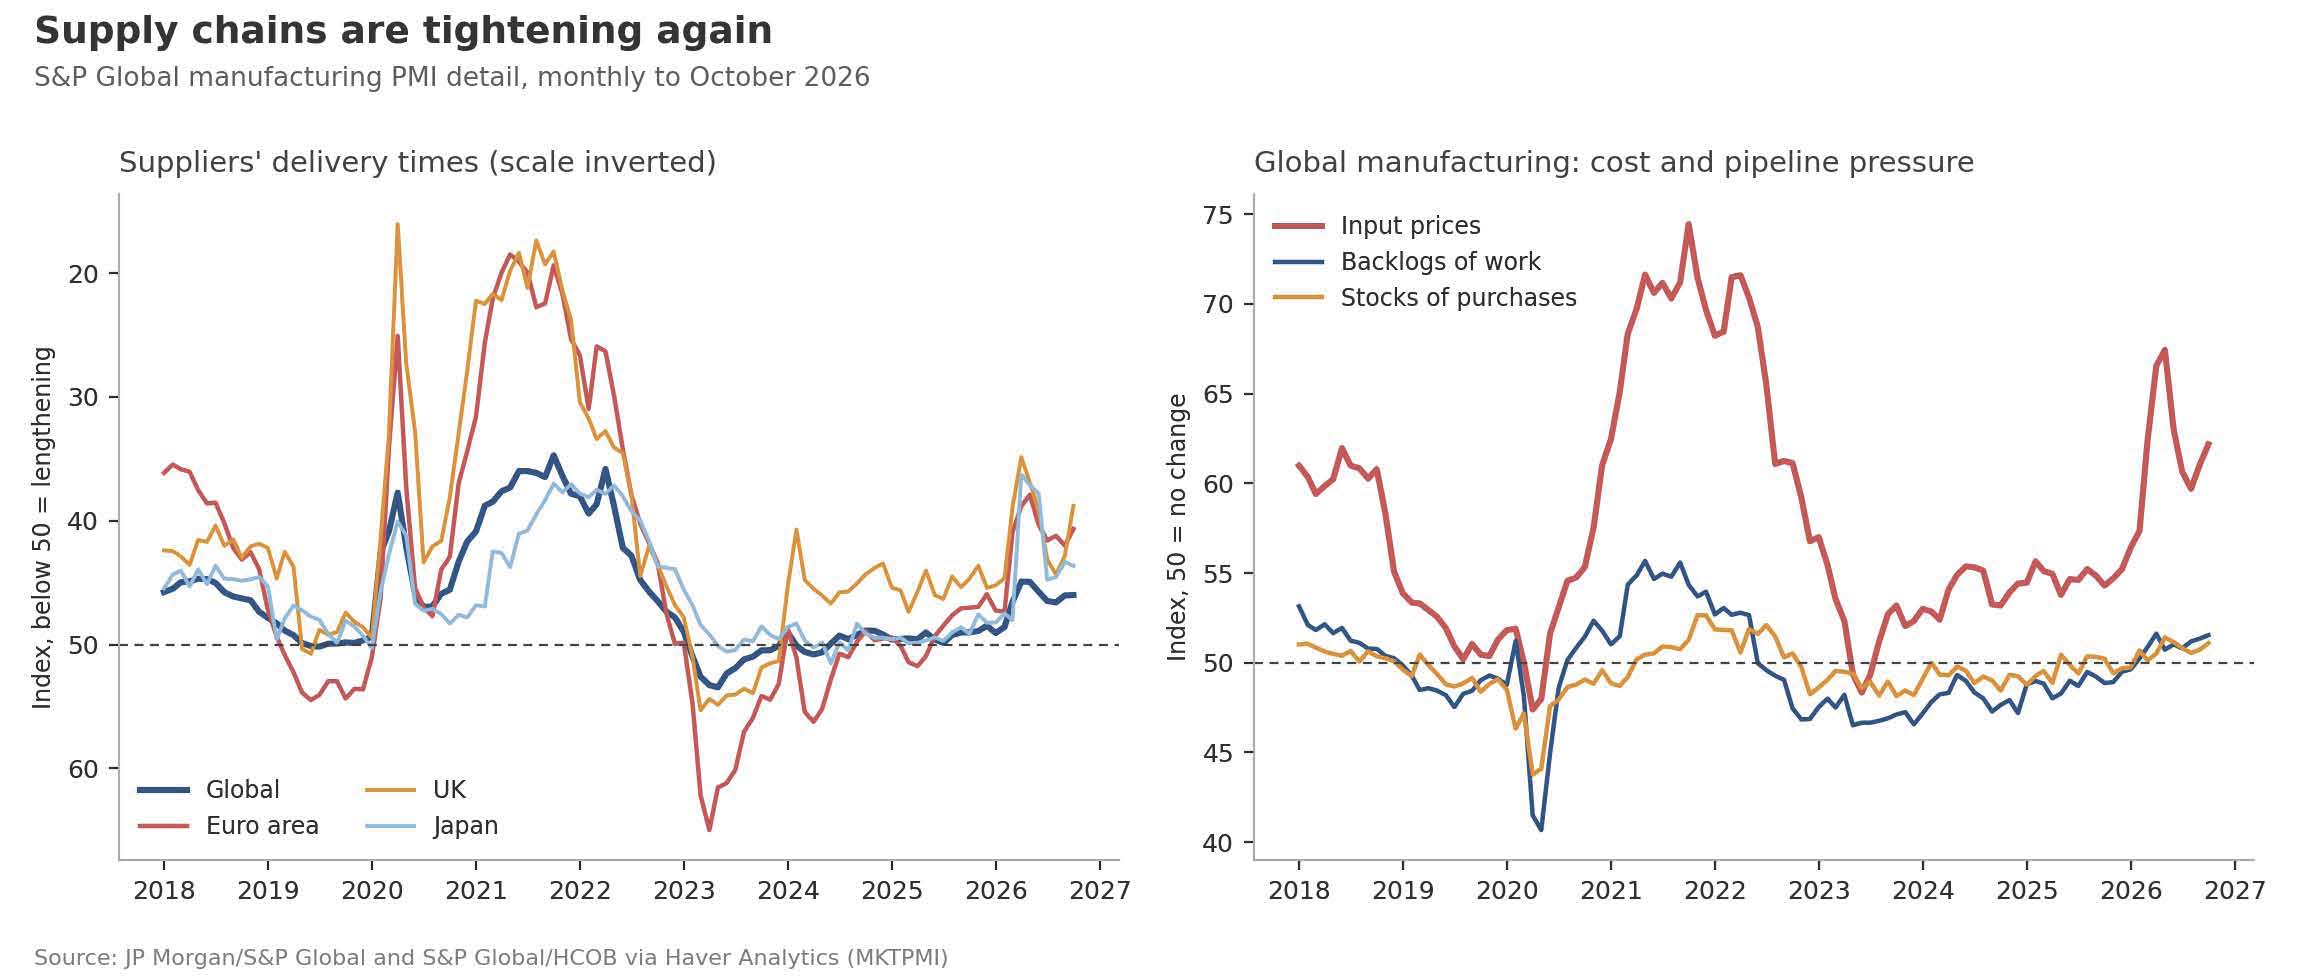
Lead times lengthen again This week’s manufacturing PMI surveys suggest that supply constraints are returning just as demand is becoming more uneven. Manufacturers across major economies report longer delivery times and renewed pressure on input costs (chart 5). Competition for electrical equipment and specialist components, alongside tariffs and disrupted trade routes, are probably adding to the strain. This is arguably not a repeat of the supply shock of 2021–22. But it is a reminder that inflation can persist even when ordinary borrowers and consumers are retrenching. Central banks face the familiar difficulty of responding to higher prices without unnecessarily amplifying weakness elsewhere.
Chart 5: Manufacturing suppliers' delivery times and global cost and pipeline indicators
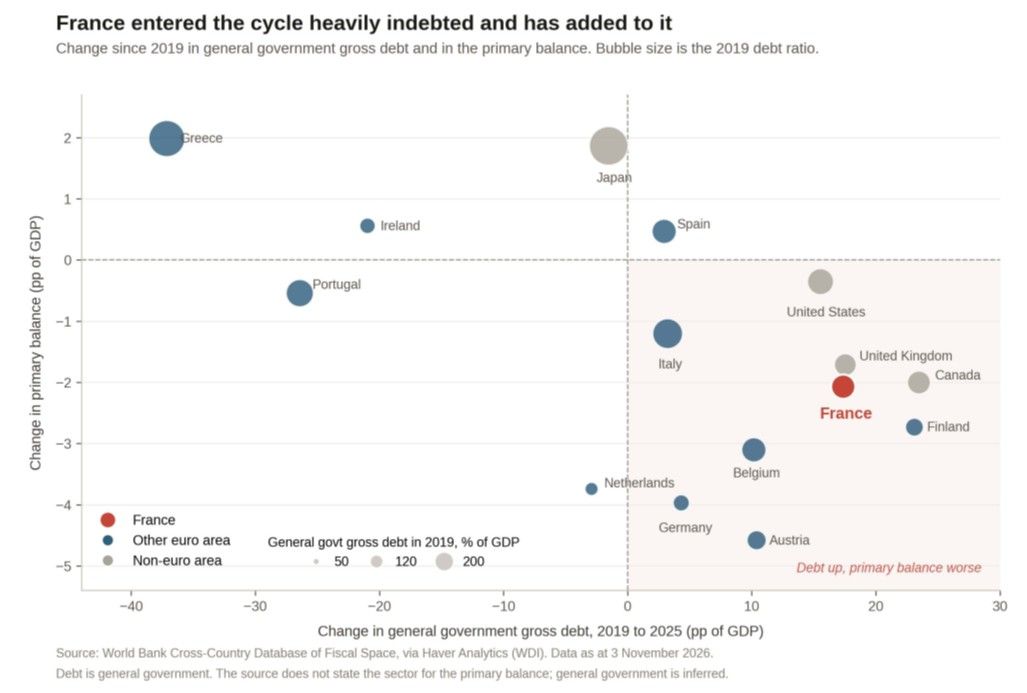
No room at the margin Fiscal policy offers little comfort. France's debt burden has risen markedly since 2019, while its primary balance and credit standing have deteriorated. Japan faces its own scrutiny, and the UK is hardly immune. By contrast, several countries once regarded as Europe's fiscal weak links have reduced their debt ratios and improved their standing (chart 6). The old division between prudent core and vulnerable periphery no longer fits the evidence. That helps explain why sovereign bond investors are paying closer attention to fiscal credibility. Yet the deeper concern is what happens if private investment falters. Governments with limited fiscal room may find themselves asked to support an economy at precisely the moment markets are least willing to finance the response.
Chart 6: Change in gross government debt and the primary balance since 2019

Andrew Cates
AuthorMore in Author Profile »Andy Cates joined Haver Analytics as a Senior Economist in 2020. Andy has more than 25 years of experience forecasting the global economic outlook and in assessing the implications for policy settings and financial markets. He has held various senior positions in London in a number of Investment Banks including as Head of Developed Markets Economics at Nomura and as Chief Eurozone Economist at RBS. These followed a spell of 21 years as Senior International Economist at UBS, 5 of which were spent in Singapore. Prior to his time in financial services Andy was a UK economist at HM Treasury in London holding positions in the domestic forecasting and macroeconomic modelling units. He has a BA in Economics from the University of York and an MSc in Economics and Econometrics from the University of Southampton.
More Economy in Brief