March PPI: Tame Excluding Energy
Summary
- Energy prices surged in March, but most other items showed modest changes.
- Tame readings were a relief from hints of upward pressure in prior months.
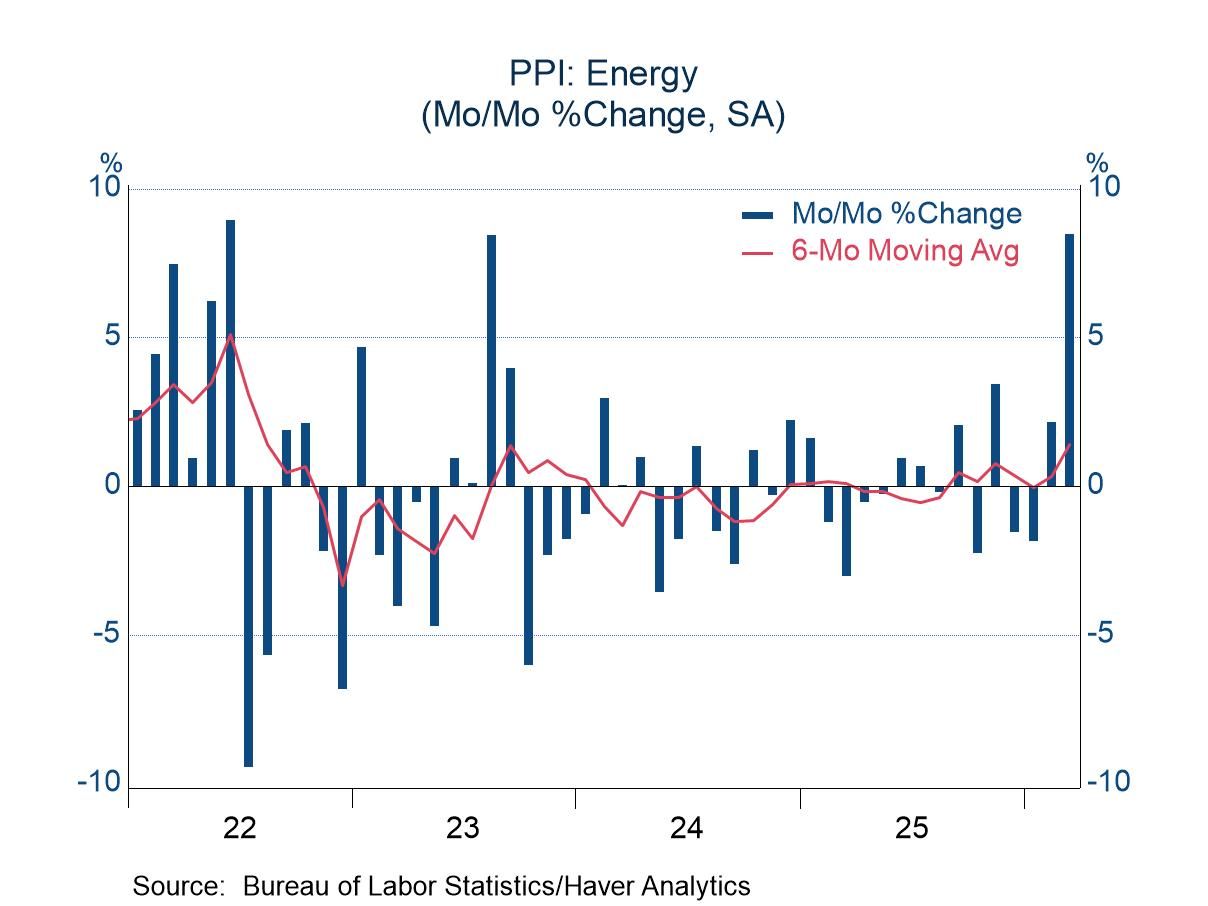
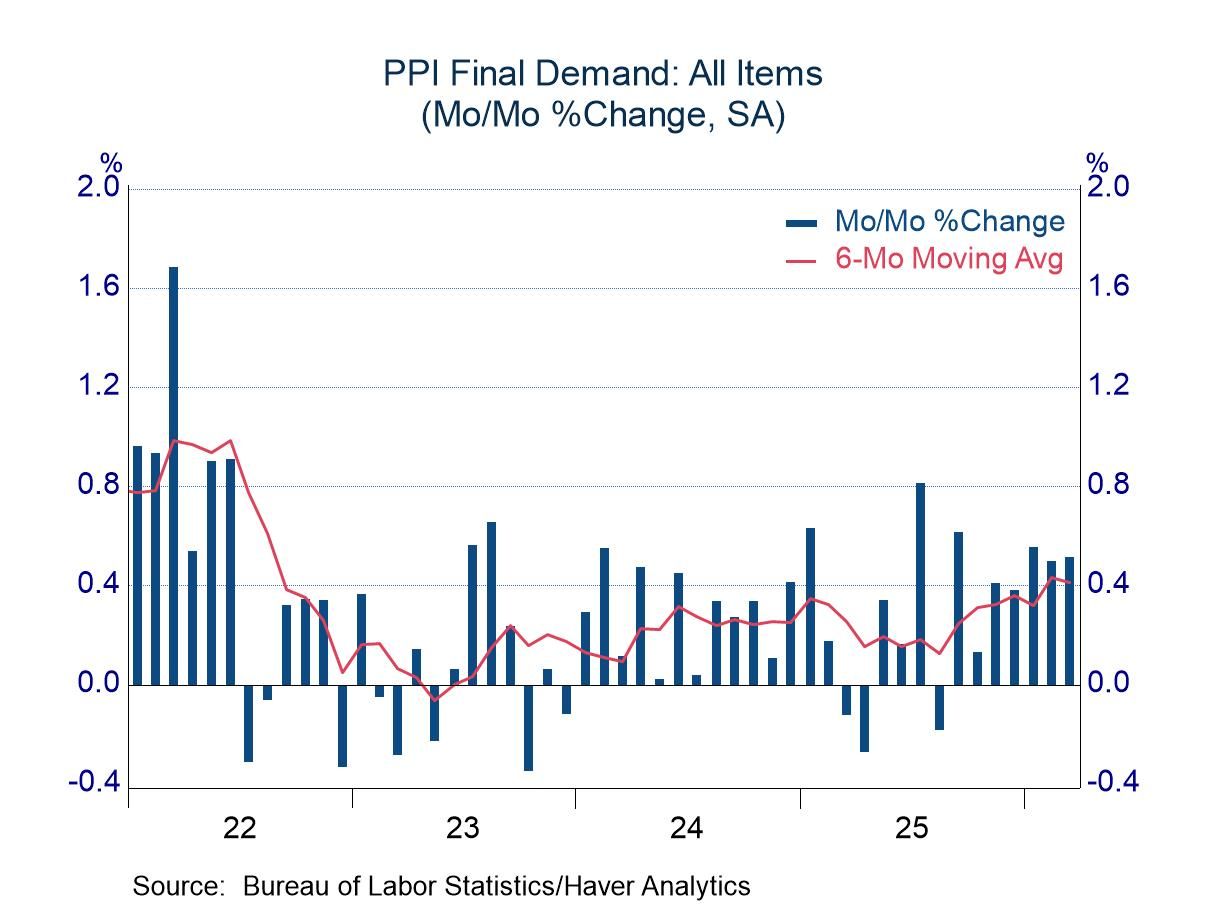
As widely expected, energy prices surged in March, with the increase of 8.5% among the firmest in the history of the series. A reading in August 2023 was close (8.4%), and the increase in June 2022 was a touch firmer (8.9%). Only the June 2020 observation was decidedly stronger at 9.6%. (Data on the current version of the PPI begin in 2010.) The jump in energy prices pushed the headline index 0.5% higher, an uncomfortable reading but better than expectations in the market, which clustered in the range of 0.8% to 1.2%.
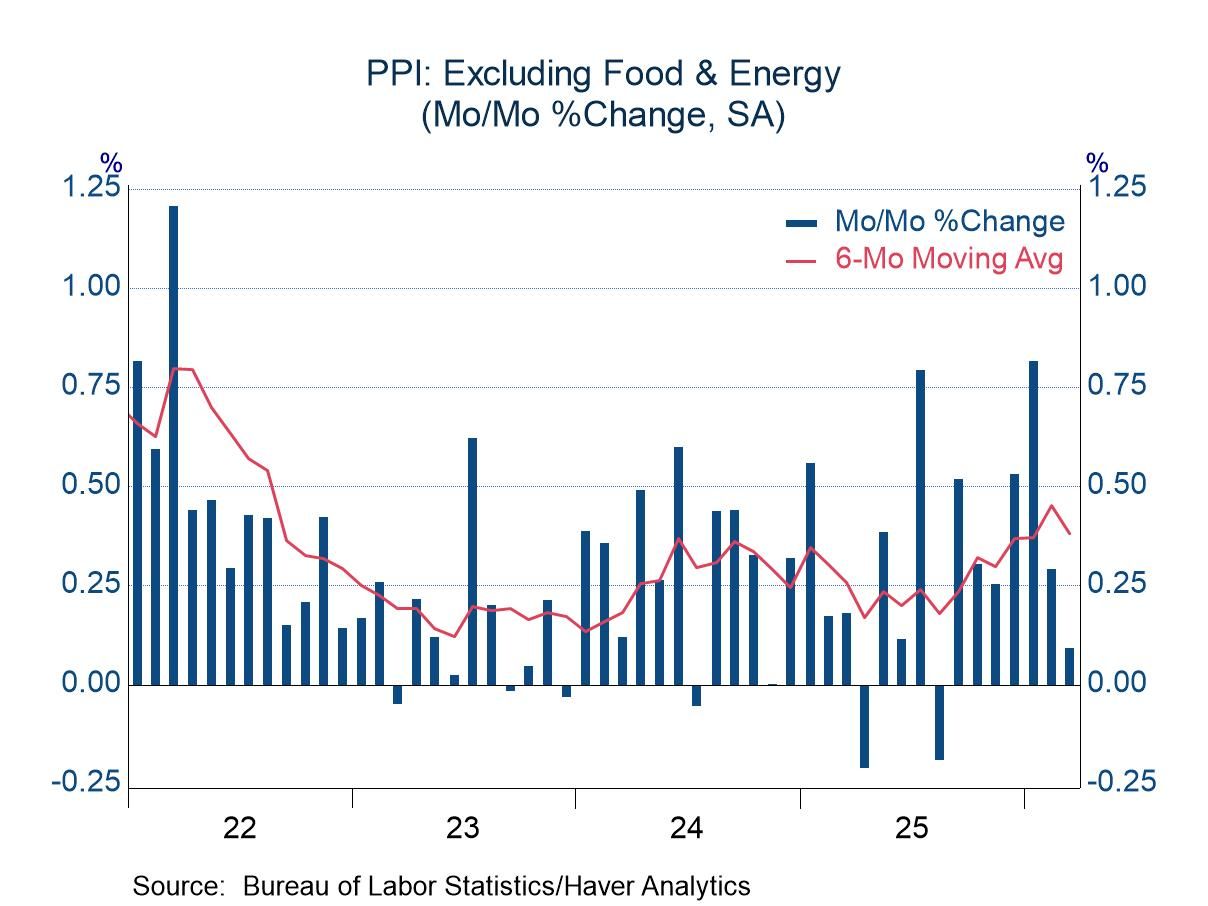
March represented the third consecutive month with a headline increase of 0.5%, and the advances in the prior two months were not entirely due to energy. Prices excluding food and energy also rose 0.5% in January and February (and December as well), which might stir thoughts of accelerating inflation.
However, pressure outside of energy cooled in March. Food prices fell 0.2% and prices excluding food and energy rose only 0.1%. Service prices, which rose an average of 0.6% in the prior three months, increased less than 0.1%. The modest changes outside of food and energy raised the prospect that an upward trend that seemed to be developing might now be fading. The March change, alone with a less-than-troubling increase in February, led to a downward tilt in the six-month moving average of core price changes (chart, below left).
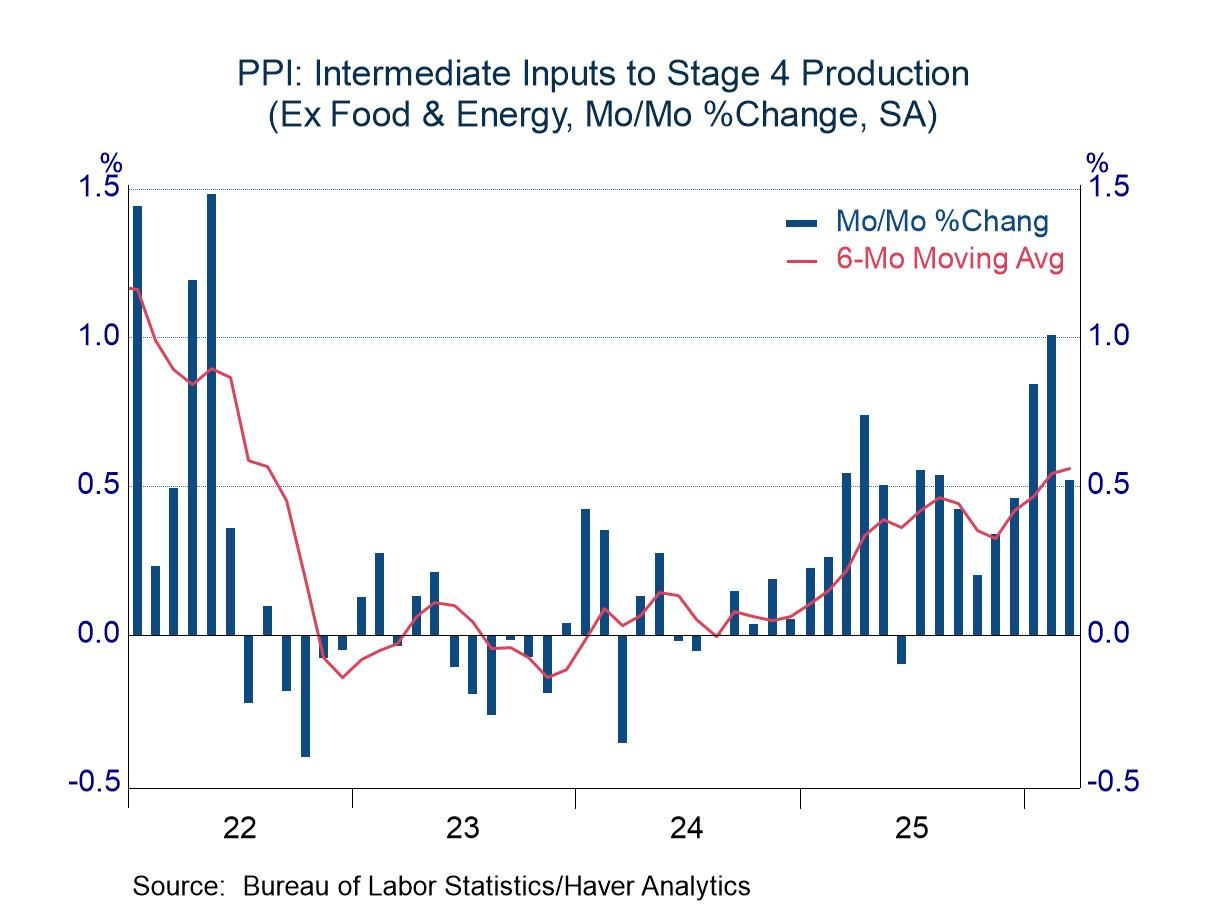
All of the prices in the headline PPI and its components are final prices – that is, prices paid by the ultimate buyer of goods and services. For goods, the products involved will not undergo further processing. The full report on producer prices also includes price indexes for intermediate inputs. These indexes could provide clues on what might unfold for finished goods in months ahead. This obscure part of the PPI also offered a hint of encouragement.
Input prices for stage four production (i.e. the final stage of the production process) rose 0.5% in March. The increase, while hefty, was slower than the results in the prior two months and it stabilized the upward trend in the six-month average (chart, below right). The input price indexes should be interpreted cautiously because they tend to be more volatile than those for finished goods, but with broad-based cooling in March, this measure might have signal value in this instance.
The PPI data are published by the Bureau of Labor Statistics and can be found in Haver’s USECON database. Further detail is contained in PPI and PPIR. The expectations figures are available in the AS1REPNA database.

Michael J. Moran
AuthorMore in Author Profile »Before joining Haver Analytics in 2025, Michael J. Moran was the chief economist of Daiwa Capital Markets America Inc. He was responsible for preparing the firm’s economic forecast and interest rate outlook. He traveled frequently to visit the clients of Daiwa Capital Markets and wrote weekly economic commentary. Mr. Moran also was involved in the flux of financial markets, as he spent a portion of each day on Daiwa’s trading floor interpreting economic statistics and Federal Reserve activity for traders and salespeople. Mr. Moran is quoted frequently in the financial press, and he appears regularly on cable news shows. He also has published articles in several journals and periodicals. Before joining Daiwa Capital Markets America, Mr. Moran worked as an economist at the Federal Reserve Board in Washington, D.C. where he analyzed a broad range of issues dealing with the financial sector of the economy and regularly briefed the Board of Governors. He was on the faculty of Pennsylvania State University from 1979 to 1980 and taught on a part-time basis at George Washington University from 1980 to 1987.
Mr. Moran received his Ph.D. in economics from Pennsylvania State University in 1980 and a B.S. in business administration from the University of Bridgeport in 1975. He was a CFA charter holder from 2002 until 2016.
More Economy in Brief


 Global