June CPI: Cooling Energy Prices and a Restrained Core Component
Summary
- The energy component retraced a portion of its surge in the prior three months.
- Prices excluding food and energy provided a surprise by posting a rare decline.
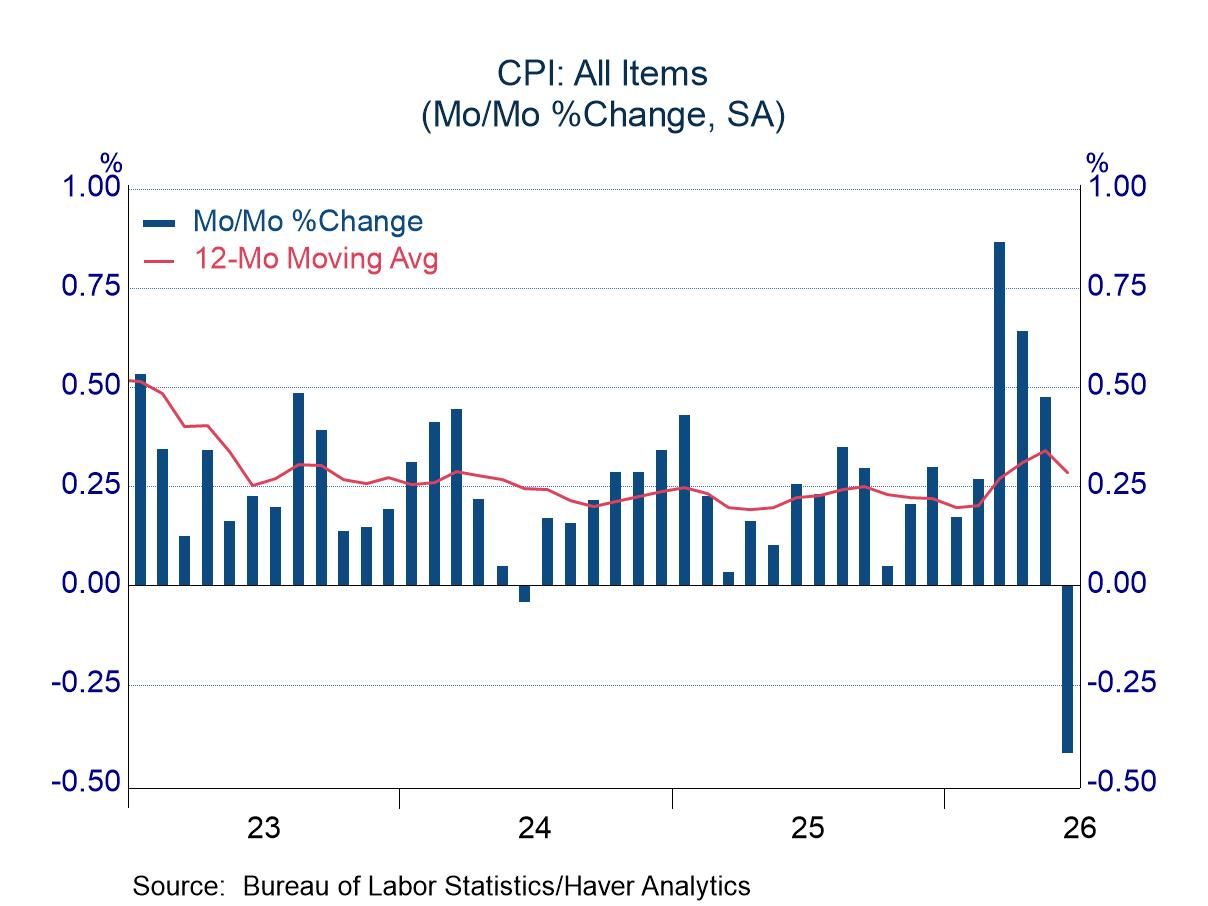
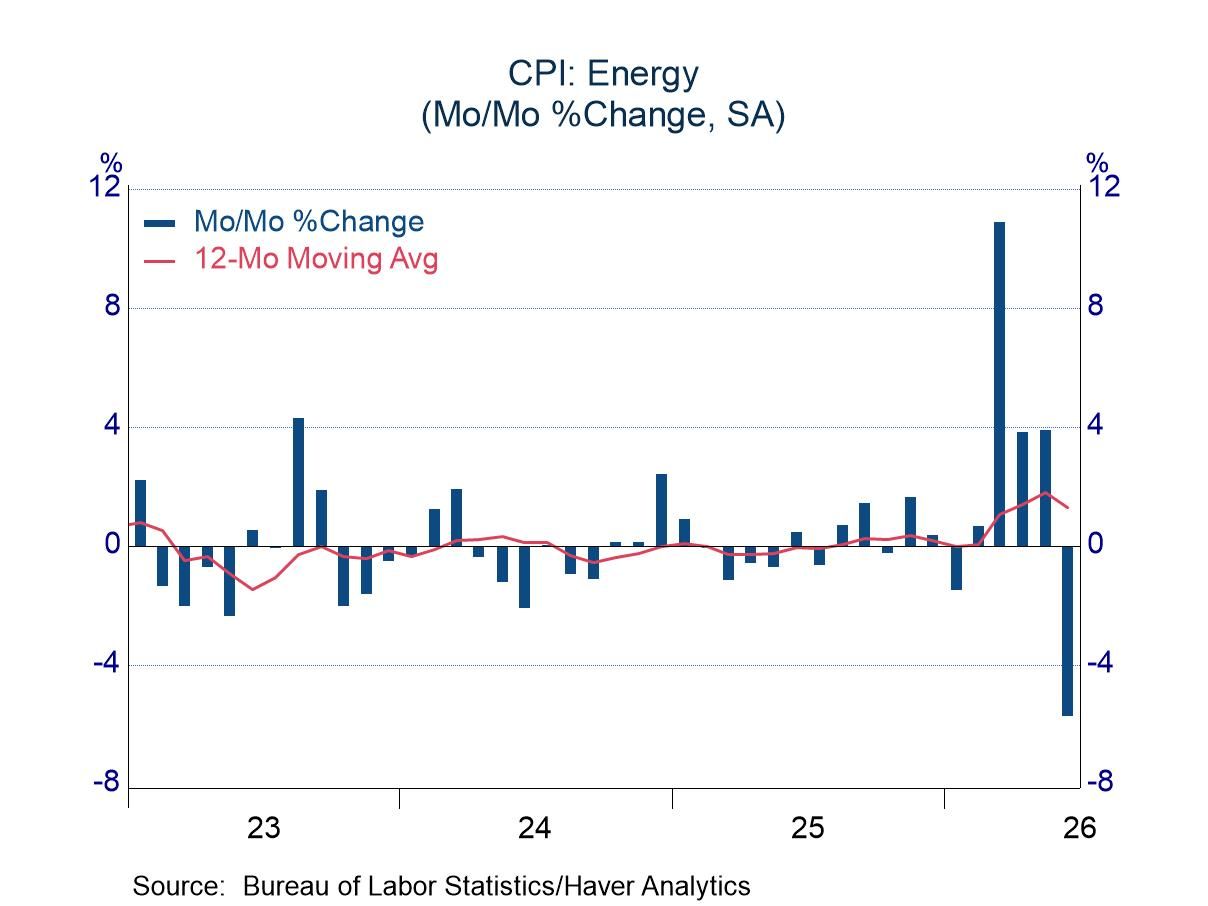
Most analysts were looking for a dip in the CPI because of a likely retreat in gasoline prices, but the published decline of 0.4% in the headline index was noticeably softer than the consensus estimate of -0.1%. Gasoline prices did not disappoint, with a drop of 9.7% offsetting approximately one-quarter of the cumulative surge in the prior three months. Prices of fuel oil fell almost as much as gasoline prices, and electricity charges contributed to the softness with a decline of 1.0%. The price of natural gas services was the only major energy item to increase in June (0.5%). All told, the energy component of the CPI fell 5.7% after climbing 19.6% in the prior three months.
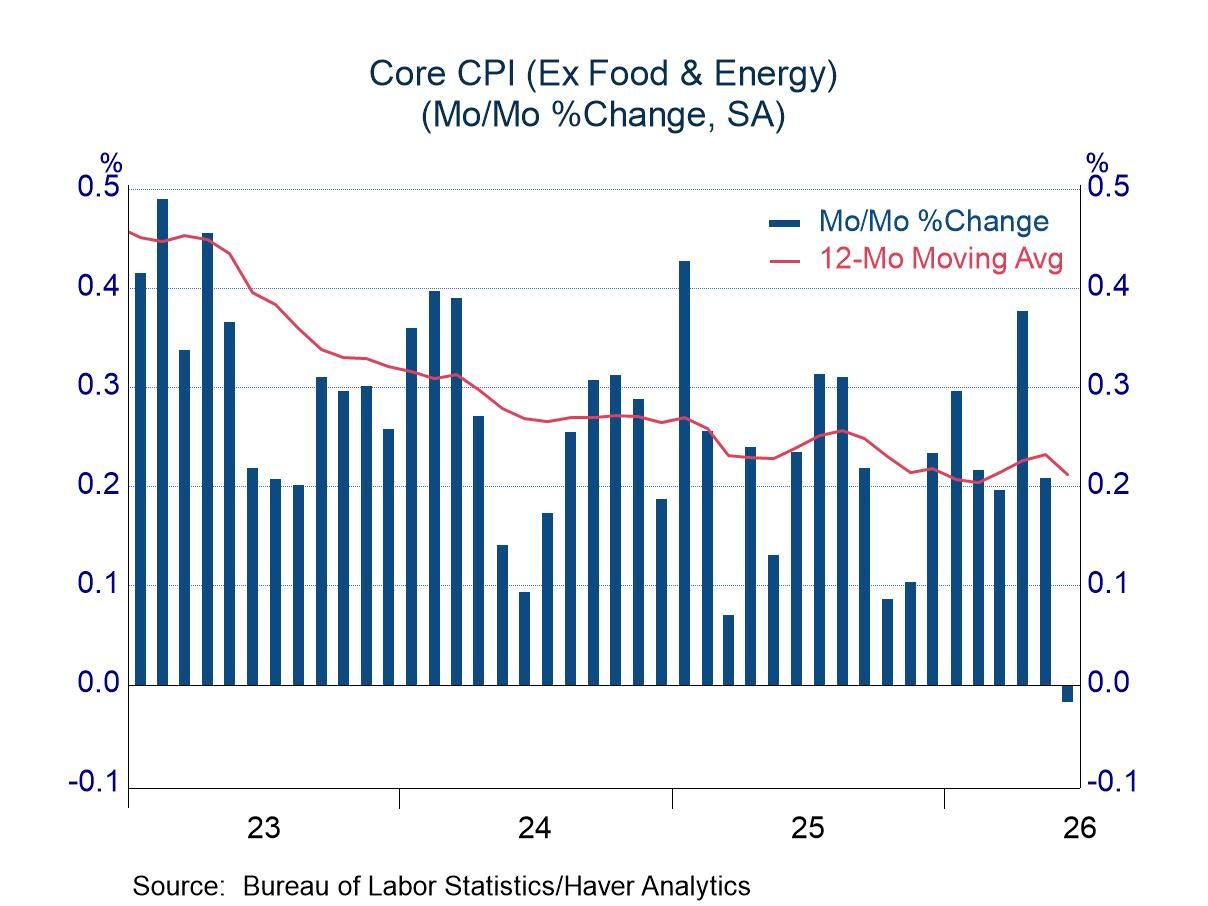
The drop in energy prices was notable, but the core component provided a bigger surprise by posting a decline, the first since a series of three consecutive decreases during the pandemic. Before the pandemic-related retreat, the core component fell only twice from 1990 to 2019. The drop in June was minuscule (-0.02%), but the fact that it carried a minus sign was striking.
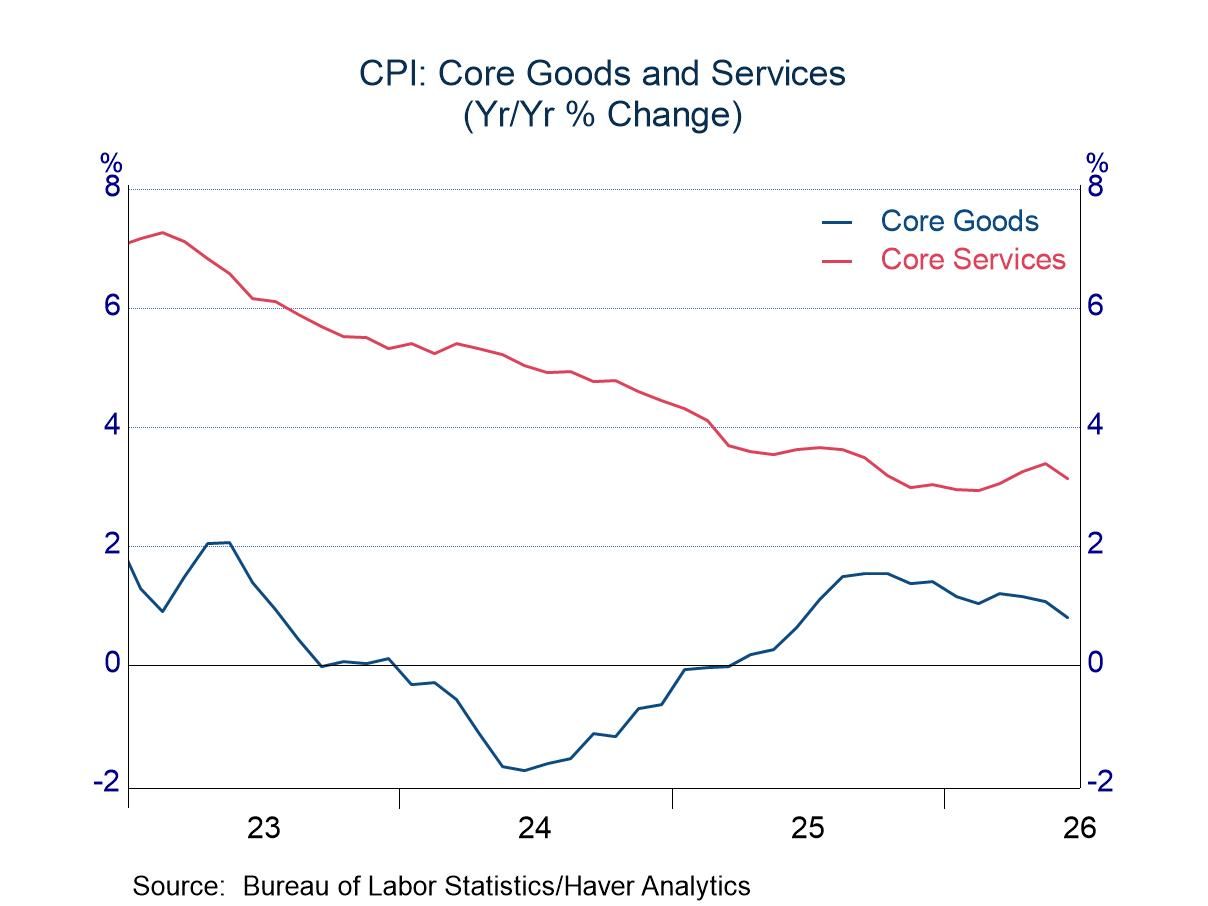
Both the goods and services components of the core index contributed to the restraint. Prices of goods other than food and energy fell 0.1%. The Bureau of Labor Statistics publishes six key subcategories of core goods, and five of them fell in June. Apparel prices stood out with a decline of 0.6%. Prices of core services were nearly unchanged at 0.03%, restrained by declines in medical services and motor vehicle insurance. Airfares, which showed upward pressure from rising fuel prices in the prior three months, posted a nondescript increase of 0.2%. The modest increase in the prices of core services led to a dip in the 12-month average increase after stepping up in April and May. The trend in core goods prices continued its gradual deceleration (chart, below right).
Food prices in June rose 0.2%, a reading comfortably within the range of the past few years.
The Consumer Price figures can be found in Haver's USECON database. The expectations figure is contained in the AS1REPNA database.

Michael J. Moran
AuthorMore in Author Profile »Before joining Haver Analytics in 2025, Michael J. Moran was the chief economist of Daiwa Capital Markets America Inc. He was responsible for preparing the firm’s economic forecast and interest rate outlook. He traveled frequently to visit the clients of Daiwa Capital Markets and wrote weekly economic commentary. Mr. Moran also was involved in the flux of financial markets, as he spent a portion of each day on Daiwa’s trading floor interpreting economic statistics and Federal Reserve activity for traders and salespeople. Mr. Moran is quoted frequently in the financial press, and he appears regularly on cable news shows. He also has published articles in several journals and periodicals. Before joining Daiwa Capital Markets America, Mr. Moran worked as an economist at the Federal Reserve Board in Washington, D.C. where he analyzed a broad range of issues dealing with the financial sector of the economy and regularly briefed the Board of Governors. He was on the faculty of Pennsylvania State University from 1979 to 1980 and taught on a part-time basis at George Washington University from 1980 to 1987.
Mr. Moran received his Ph.D. in economics from Pennsylvania State University in 1980 and a B.S. in business administration from the University of Bridgeport in 1975. He was a CFA charter holder from 2002 until 2016.
More Economy in Brief
 Global