ISM Manufacturing: A Dip in August, but still Signaling Expansion
Summary
- New orders accounted for most of the easing in the headline index.
- The production index showed a small decline; the employment index posted a moderate drop.
- The prices index was unchanged at an elevated level, but still below recent peaks.
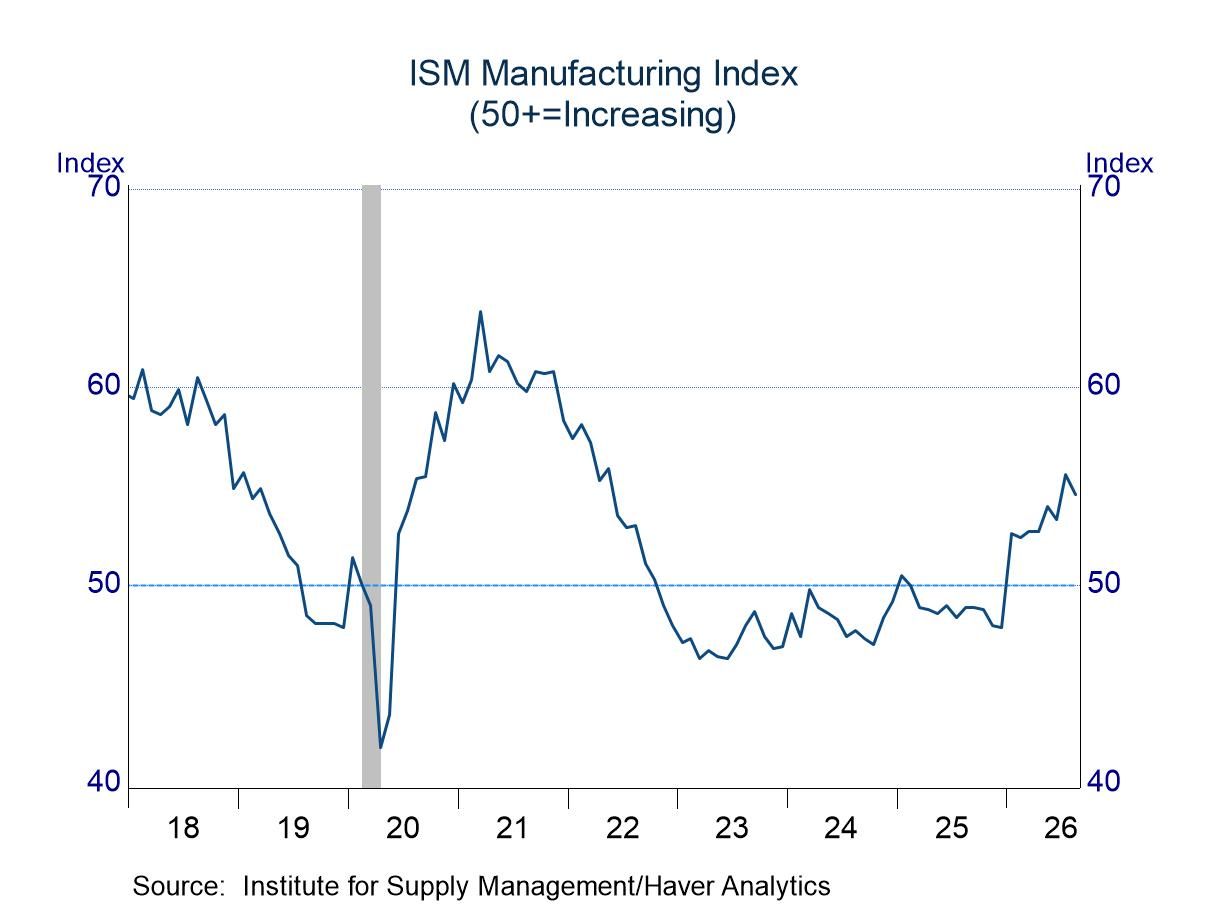
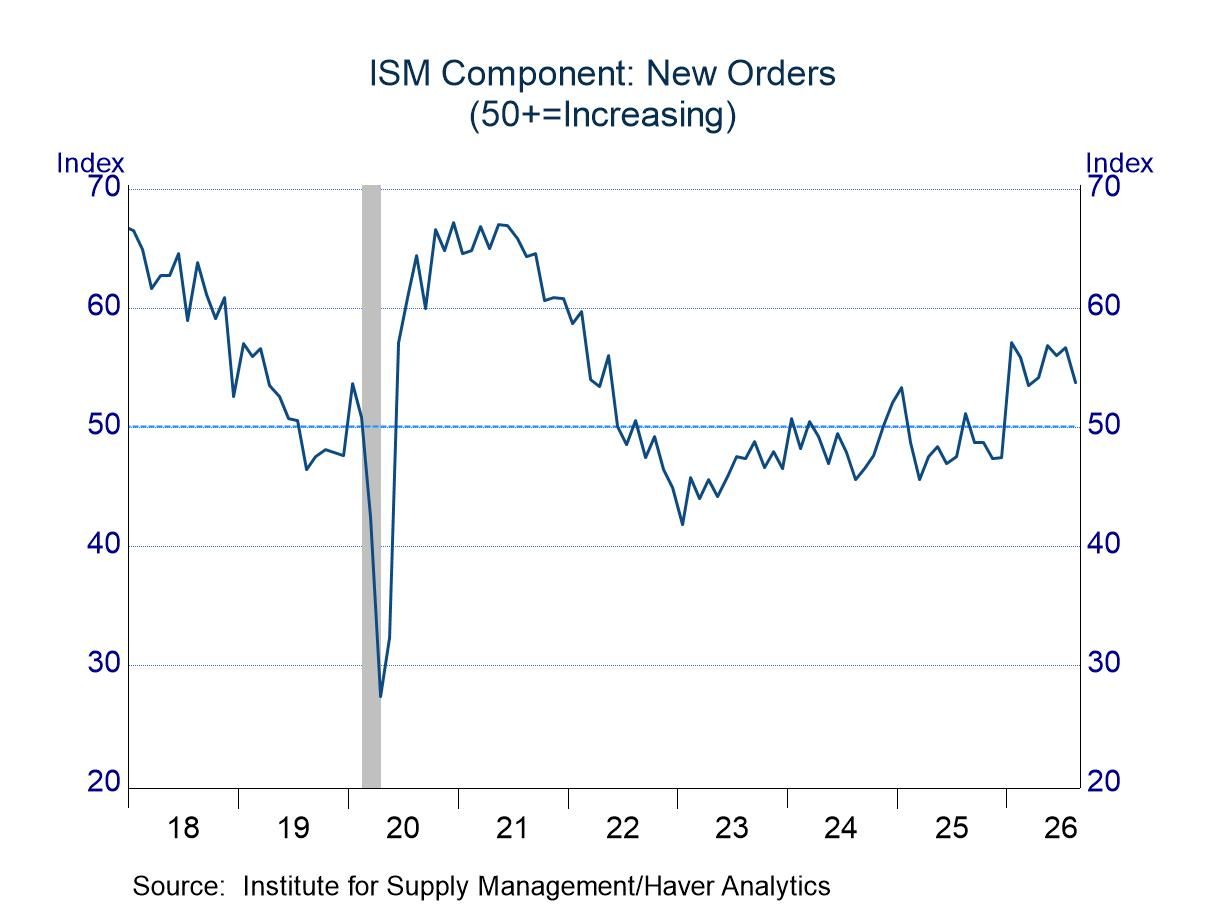
The manufacturing index published by the Institute for Supply Management (ISM) fell 1.0 index point in August, but the reading of 54.6 still suggested a solid performance in the manufacturing sector. (The index can range from 0 to 100, with 50 representing the critical point separating expansion from contraction.) August marked the eighth consecutive month with a reading above 50, and the past two observations were the best of the year thus far (chart, above left).
The performance of the index this year represents a marked improvement from that in the prior three years. Indeed, the headline index was at 50 or above in only two months during the 2023-25 time span (and barely so at that: 50.5 and 50.0 in January and February 2025).
The new orders component accounted for most of the softening in the headline measure in August, falling 3.0 points to 53.7 (chart, above right). Still, the new orders index remained within the range of observations so far this year, and the average reading of 55.46 in the past eight months easily exceeds the average of 47.69 in the prior three years. The slowdown in new orders led to a similar-sized drop in the backlog of bookings, as this index fell 3.2 points to 51.8 (this item is not seasonally adjusted). Like new orders, the backlog index remained within the range of observations this year and represented a far better performance than that in the prior three years.
The slowdown in orders had little effect on the pace of production, as this component fell only marginally (down 0.2 point to 58.3) and remained comfortably above results in the first six months of the year (which averaged of 54.07). The employment component registered a slightly larger response, dropping 1.6 points to 51.2. Despite the easing in the employment index, the reading above 50 was encouraging, as this measure was below the expansion/contraction threshold in the first six months of the year. In fact, July and August marked the first above-50 readings since September 2023.
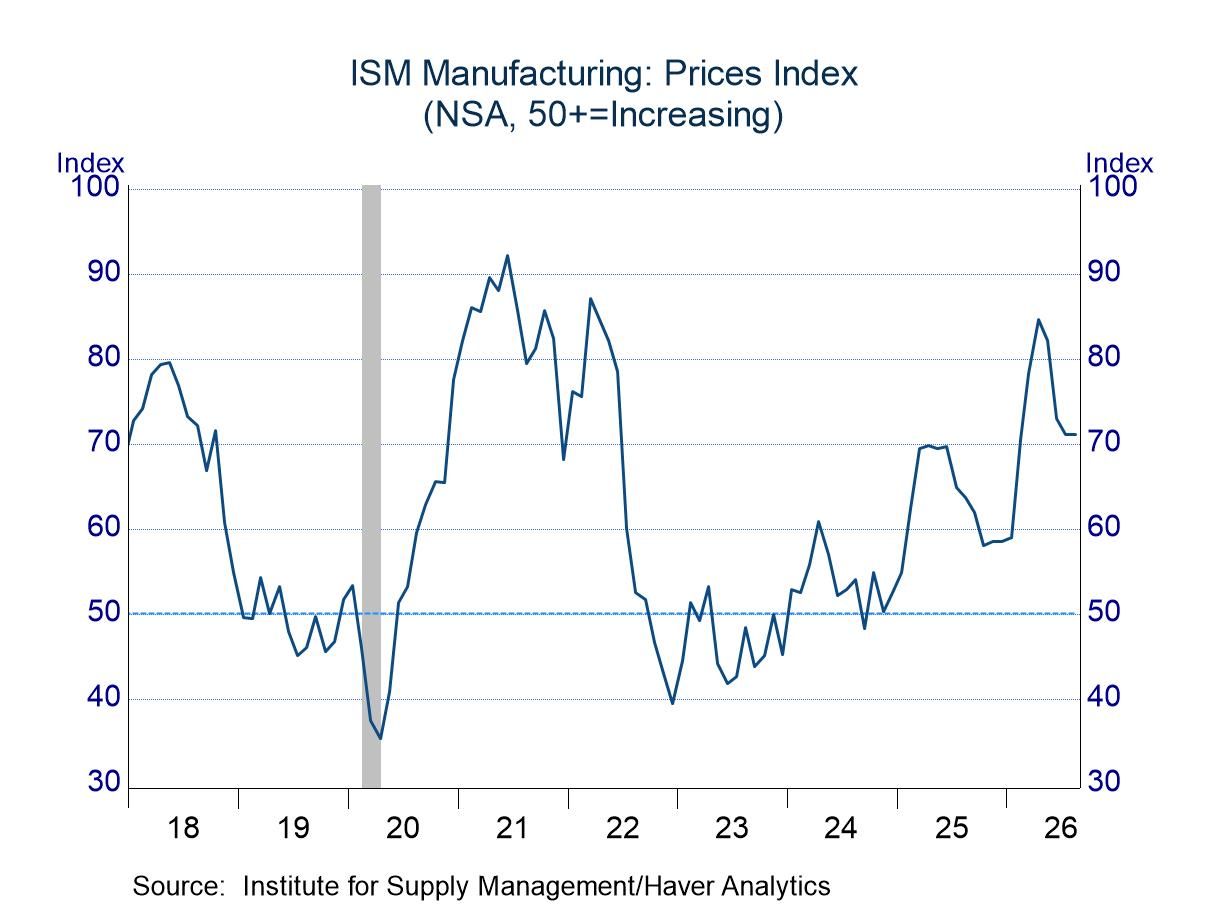
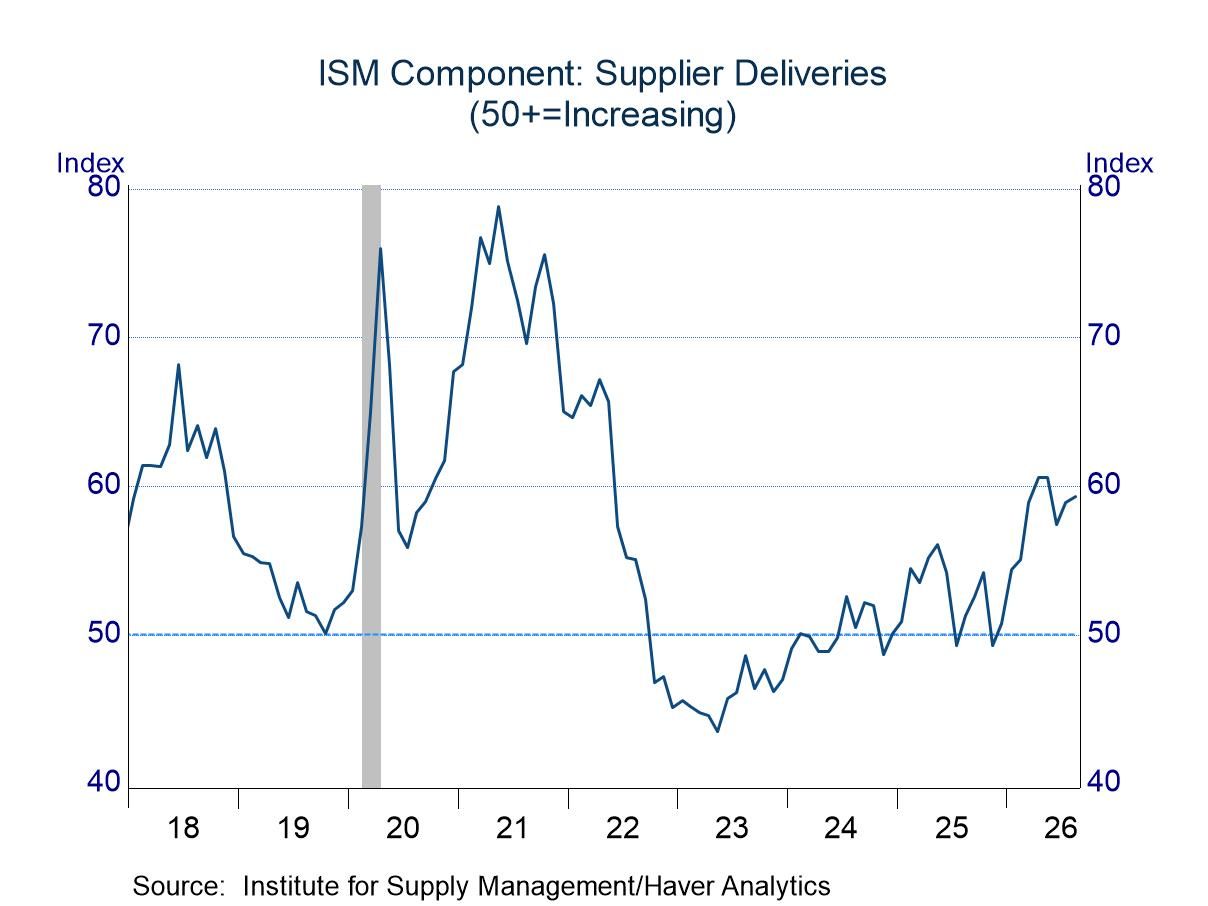
The prices index, which is not a component of the headline measure and is not seasonally adjusted, was unchanged at 71.7. A reading far above the critical point of 50 might seem striking, but this measure often runs high; readings above 80 are not uncommon. In fact, the recent high was 84.6 in April and the index touched 92.1 during the inflationary burst in 2021-22. Much of the pressure, no doubt, reflects the jump in energy prices this year and supply chain disruptions stemming from the conflict in the Middle East. Problems with supply chains were evident in the supplier delivery index, which rose 0.4 point to 59.3 (higher values in this measure signal slower delivery times). The latest observation remained below the recent highs of 60.6 in April and May, but those observations were above readings in other recent years, signaling difficulty in securing supplies (charts, below).
The ISM figures are based on responses from over 400 purchasing and supply executives from 18 industries, which are weighted according to each industry’s contribution to GDP. These data are diffusion indexes where a reading above 50 indicates expansion; below 50 indicates contraction. The ISM Manufacturing PMI is a composite index based on the diffusion indexes of five of the indexes (seasonally adjusted) with equal weights: New Orders, Production, Employment, Supplier Deliveries, and Inventories. The figures from the Institute for Supply Management can be found in Haver’s USECON database; further detail is found in the SURVEYS database. The expectations number is available in Haver’s AS1REPNA database.

Michael J. Moran
AuthorMore in Author Profile »Before joining Haver Analytics in 2025, Michael J. Moran was the chief economist of Daiwa Capital Markets America Inc. He was responsible for preparing the firm’s economic forecast and interest rate outlook. He traveled frequently to visit the clients of Daiwa Capital Markets and wrote weekly economic commentary. Mr. Moran also was involved in the flux of financial markets, as he spent a portion of each day on Daiwa’s trading floor interpreting economic statistics and Federal Reserve activity for traders and salespeople. Mr. Moran is quoted frequently in the financial press, and he appears regularly on cable news shows. He also has published articles in several journals and periodicals. Before joining Daiwa Capital Markets America, Mr. Moran worked as an economist at the Federal Reserve Board in Washington, D.C. where he analyzed a broad range of issues dealing with the financial sector of the economy and regularly briefed the Board of Governors. He was on the faculty of Pennsylvania State University from 1979 to 1980 and taught on a part-time basis at George Washington University from 1980 to 1987.
Mr. Moran received his Ph.D. in economics from Pennsylvania State University in 1980 and a B.S. in business administration from the University of Bridgeport in 1975. He was a CFA charter holder from 2002 until 2016.
More Economy in Brief
 Global