

 Global| Oct 18 2026
Interest on the Public Debt Is a Metastasizing Budgetary Cancer
|in:Viewpoints
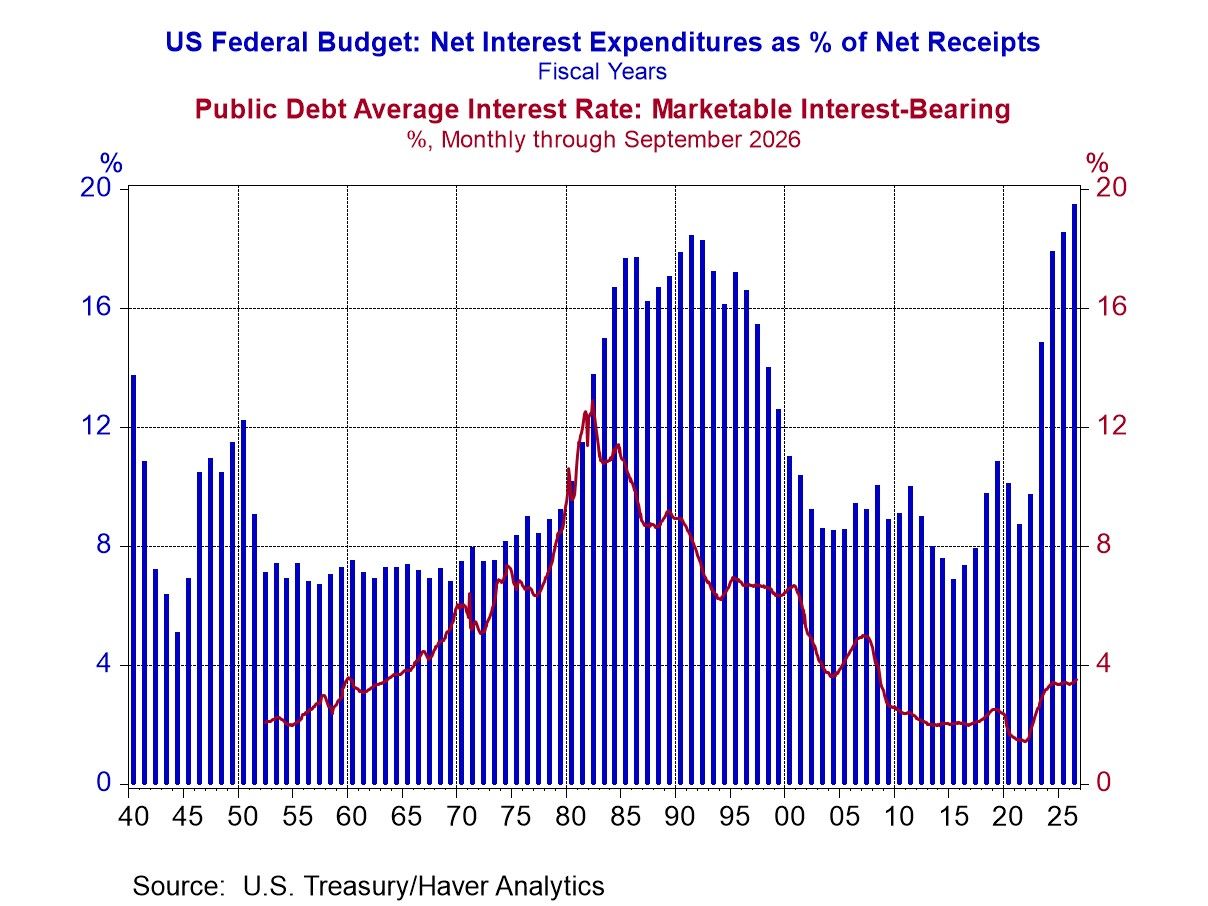
The Treasury released its monthly September 2026 and Fiscal Year (FY) budget data on October 16, 2026. As expected, it showed that interest on the debt exceeded national defense expenditures in FY 2026 and that as a percent of net Treasury receipts, interest on the debt reached 19.5%, the highest at least since 1940. Given the amount of marketable Treasury securities that have to be refinanced in the next three years, not to mention additions to the outstanding stock of Treasury securities due to persistent budget deficits, and given the current and expected level of interest rates, interest on the debt is on track to continue to grow absolutely and relatively. The Treasury is borrowing more and more just to pay the interest on its debt. With an upward-sloping Treasury yield curve (the yields on longer-maturity Treasury securities are higher than those on shorter-maturity issues), Treasury Secretary Bessent is shortening the maturity of outstanding Treasury securities by issuing new short-maturity debt and funding the buyback outstanding longer-maturity debt with short-maturity debt in an effort to mitigate the interest expense on the public debt. But if the Federal Reserve were to increase the federal funds rate in an effort to lower the inflation rate, this would frustrate Treasury Secretary Bessent’s plan. If the Federal Reserve were to reach an “accord” with the Treasury to keep the federal funds rate artificially low, the increase in interest on the public debt could be mitigated. This would be debt default by another name – higher inflation.
Let’s look at some data. Plotted in Chart 1 are the fiscal year observations of net interest payments on federal debt as percent of net receipts of the Treasury (the blue bars) and the monthly observations of the average interest rate on Treasury marketable interest-bearing debt through September 2026 (the red line). In FY 2026, net interest on the federal debt was 19.5%, the highest in decades. The last time interest as a percent of net budget receipts approached FY 2026’s level was in the mid 1980s through the late 1990s, when the average interest rate on marketable debt was considerably higher than it was in FY 2026. For example, the average interest rate on marketable Treasury debt in September 1991 was 8.058% as interest in relation to net receipts was 18.4%. As of September 2026, the average interest rate on outstanding marketable Treasury debt was only 3.518% while interest as a percent of net receipts was a full percentage point higher than it was in FY 1991. Obviously, the reason for this is that there is a much larger outstanding stock of federal interest-bearing debt.
Chart 1
Because the federal government will be running deficits for as far as the eye can see, the amount of outstanding federal debt will continue to increase, which, unless interest rates should fall precipitously, means that interest expenditures on Treasury debt will continue to increase. But let’s leave increases in the outstanding Treasury debt aside and look at just the amount of debt that has to be refinanced in the next three years.
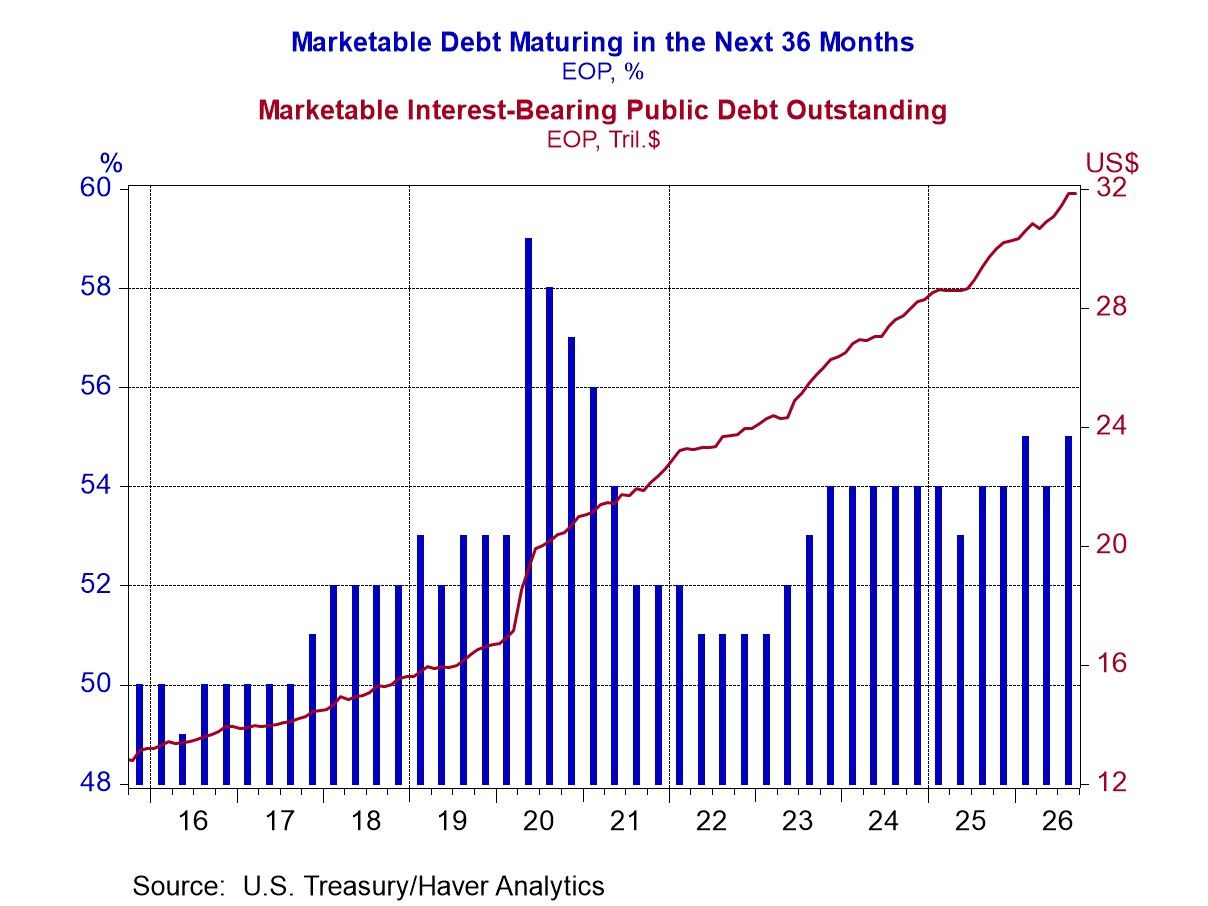
Plotted in Chart 2 are the quarter-end percentages of outstanding Treasury marketable debt that is maturing in the next 36 months (the blue bars) and the outstanding stock of Treasury marketable debt (the red line). At the end of 2026:Q3, 55% of the outstanding $31.831 trillion of Treasury debt or $17.507 trillion is maturing and, barring a fiscal miracle, will have to be refunded. Again, this is just the amount of debt that will have to be refunded. Again, barring a fiscal miracle, there will be additional new amounts of debt to be sold because of expected persistent budget deficits.
Chart 2
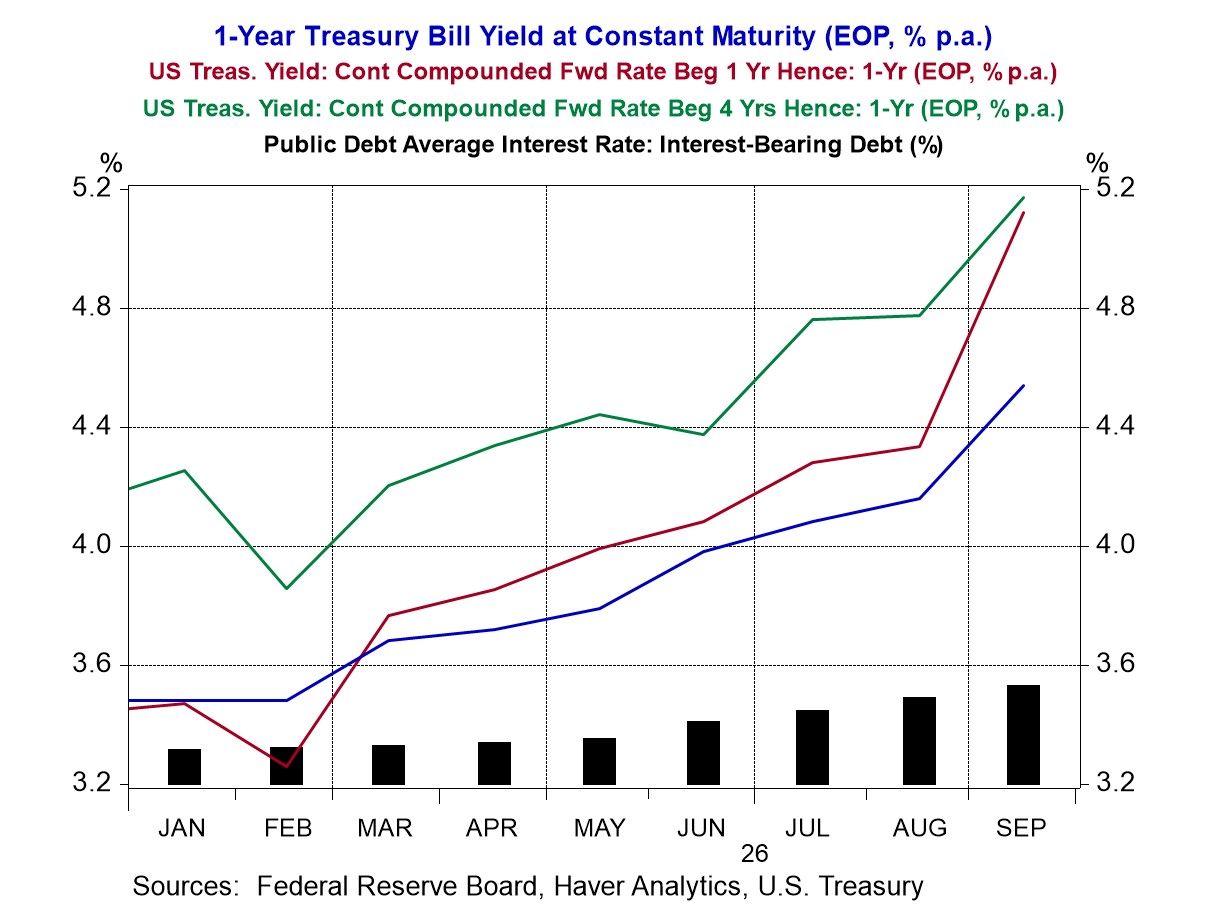
So, there is a lot of Treasury debt that needs to be refunded in the next three years, not to mention the increasing amounts of debt to fund future deficits. (By the way, the FY 2026 federal budget deficit was $1.99 trillion). What is the interest-rate outlook for refunding the debt maturing and the new debt that has to be issued to fund the coming deficits? It is higher than the current average interest rate on outstanding marketable Treasury debt. Plotted in Chart 3 are the monthly observations of the average interest rate on outstanding marketable debt (the black bars), the end-of-September 2026 levels of the one-year Treasury security rate (the blue line), the implied one-year interest rate one year ahead (the red line) and the implied one-year interest rate four years ahead (the green line). As you can see, all of these interest rates, actual or implied by the current yield curve, are considerably higher than the current average interest rate on outstanding Treasury marketable debt. This suggests that budget interest expenditures are going higher not only because of additions to the outstanding debt but also because of higher interest rates on refunded debt.
Chart 3
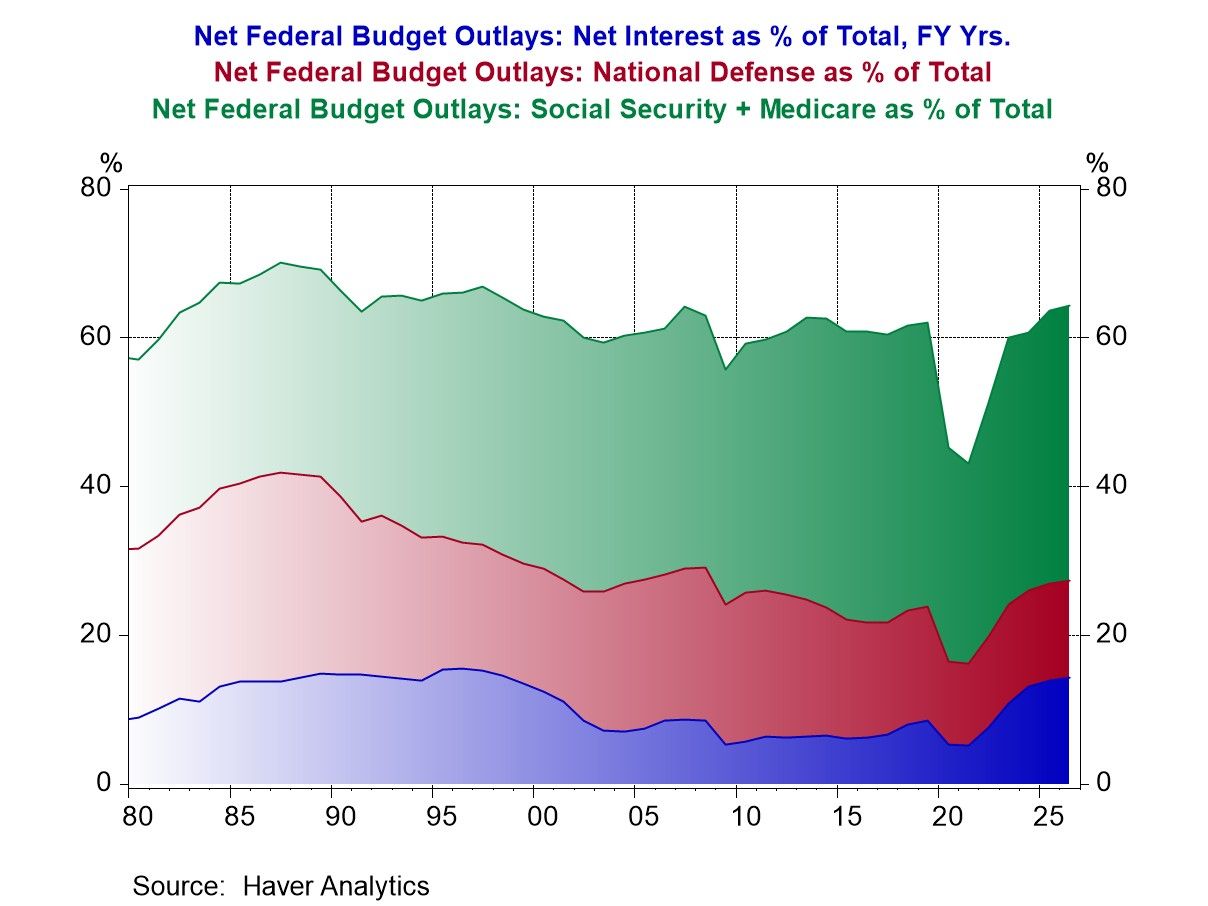
Perhaps this interest-on-debt “cancer” could be put into remission by paring future budget deficits? Perhaps. But tax increases have become the “third rail” of politics in this country. By the way, if the AI hype pans out, future tax revenues will be adversely affected because, under our current federal tax system, capital-derived income is taxed at a lower rate than labor income. If AI results in lower employment, labor taxation will be reduced. If we are politically unable to raise taxes, perhaps we can pare spending. Chart 4 speaks to the difficulty of slowing federal spending. As the chart shows, in FY 2026, as a percent of total net federal budget outlays, combined Social Security and Medicare expenditures, interest expenditures and national defense expenditures accounted for 37%, 14% and 13%, respectively. These three categories add up to 64% of total net federal expenditures. In the coming years, all three of these categories are expected to increase in absolute terms. If the federal government were to seriously contemplate cutting Social Security or Medicare benefits, there would be a “roll” on Washington, D.C. of senior citizens in their wheelchairs. Then there are Veterans’ benefits, which would be politically (and morally) difficult to slow. Perhaps Homeland Security outlays could be slowed if we reduced the number of ICE agents and their unmarked side-swiping vehicles chasing undocumented residents who have not been charged with any criminal offenses (much less convicted) or who are following the asylum rules under which they were admitted into the US. The Big Beautiful Bill will result in Medicaid savings by making it more difficult for low-income households to qualify for benefits, but there are political limits here, too.
Chart 4
Because all of our federal debt is denominated in US dollars and, via the Federal Reserve and the banking system, we can “print” US dollars, I suspect and fear that we will try to inflate our way out of this debt “disease”. After all, we measure many of our federal budgetary metrics as a percent of nominal GDP. By creating more inflation, we can create more nominal GDP, the denominator of most of our budgetary-measurement fractions.
We are not the only nation that faces fiscal challenges. France has been in the news lately regarding its fiscal problems. Most of Europe, including the UK face fiscal challenges, in part because of aging populations and the budget expenditures related to retirees. Income equality and stagnant living standards are plaguing Europe and the US. This is creating social unrest. Witness the recent street protests in France, Italy and Spain. Regrettably, there is little fiscal “headroom” to address these challenges. Quoting a British diplomat who had served in China in the 1930s, “May you live in interesting times.”

Paul L. Kasriel
AuthorMore in Author Profile »Mr. Kasriel is founder of Econtrarian, LLC, an economic-analysis consulting firm. Paul’s economic commentaries can be read on his blog, The Econtrarian. After 25 years of employment at The Northern Trust Company of Chicago, Paul retired from the chief economist position at the end of April 2012. Prior to joining The Northern Trust Company in August 1986, Paul was on the official staff of the Federal Reserve Bank of Chicago in the economic research department. Paul is a recipient of the annual Lawrence R. Klein award for the most accurate economic forecast over a four-year period among the approximately 50 participants in the Blue Chip Economic Indicators forecast survey. In January 2009, both The Wall Street Journal and Forbes cited Paul as one of the few economists who identified early on the formation of the housing bubble and the economic and financial market havoc that would ensue after the bubble inevitably burst. Under Paul’s leadership, The Northern Trust’s economic website was ranked in the top ten “most interesting” by The Wall Street Journal. Paul is the co-author of a book entitled Seven Indicators That Move Markets (McGraw-Hill, 2002). Paul resides on the beautiful peninsula of Door County, Wisconsin where he sails his salty 1967 Pearson Commander 26, sings in a community choir and struggles to learn how to play the bass guitar (actually the bass ukulele). Paul can be contacted by email at econtrarian@gmail.com or by telephone at 1-920-559-0375.