

 Global| Sep 30 2026
AI Productivity and Capacity Constraints
by:Andrew Cates
|in:Viewpoints
Artificial intelligence can lift productivity and sustain business investment. The scale and durability of the gains will depend on labour, energy, materials, finance and the policy response.
Introduction and summary messages The surge in artificial-intelligence investment is being driven by the technology's potential to raise productivity and corporate profitability. It is unfolding, however, in a world economy increasingly constrained by scarce labour, power, materials and capital. Those constraints make labour-saving technology more valuable, but they also limit how quickly the infrastructure supporting it can expand.
The initial macroeconomic effects can be favourable. If productivity rises faster than wages, unit labour costs fall. Firms can expand output without increasing employment at the same rate, supporting margins while containing underlying inflation. Stronger supply can therefore coexist with resilient demand and give monetary policy more room to accommodate growth.
The central risk comes later. Capacity and scarcity determine whether that favourable chain continues or reverses. Productivity gains can be diluted if electricity, grids, equipment, industrial materials or skilled labour become binding constraints. Inflation may then rise even before demand has weakened, leaving central banks to balance price stability against the investment needed to expand supply.
Backdrop Companies are buying computing power, software and equipment because they expect to produce more with fewer workers. Scarcity adds urgency to that calculation. Labour is expensive, trade is more fragmented and capital is no longer free. Governments are also investing in energy security, defence and domestic supply chains. Climate disruption and tighter immigration policies in some economies are adding to the pressure on energy systems, transport, construction and skilled labour.
Energy is where the tension is sharpest. Digital capital can be installed quickly; power stations, transmission lines and mines cannot. The most important price in the AI boom may therefore be the price of electricity rather than the price of a semiconductor.
The investment response is already visible. Orders for capital goods across the United States, Germany and Japan have risen for seventeen consecutive months, while Asian semiconductor exports tell the same story from the production side. Inflation-adjusted orders remain below their 2021 average, suggesting that the cycle is still relatively young.
The increase in investment is only the starting point. Its economic significance will depend on whether it produces measurable gains in output and productivity, how those gains are divided between labour and capital, and whether the expansion runs into physical or financial constraints. The framework below traces that transmission before the subsequent section considers what the available evidence suggests about how far it has progressed.
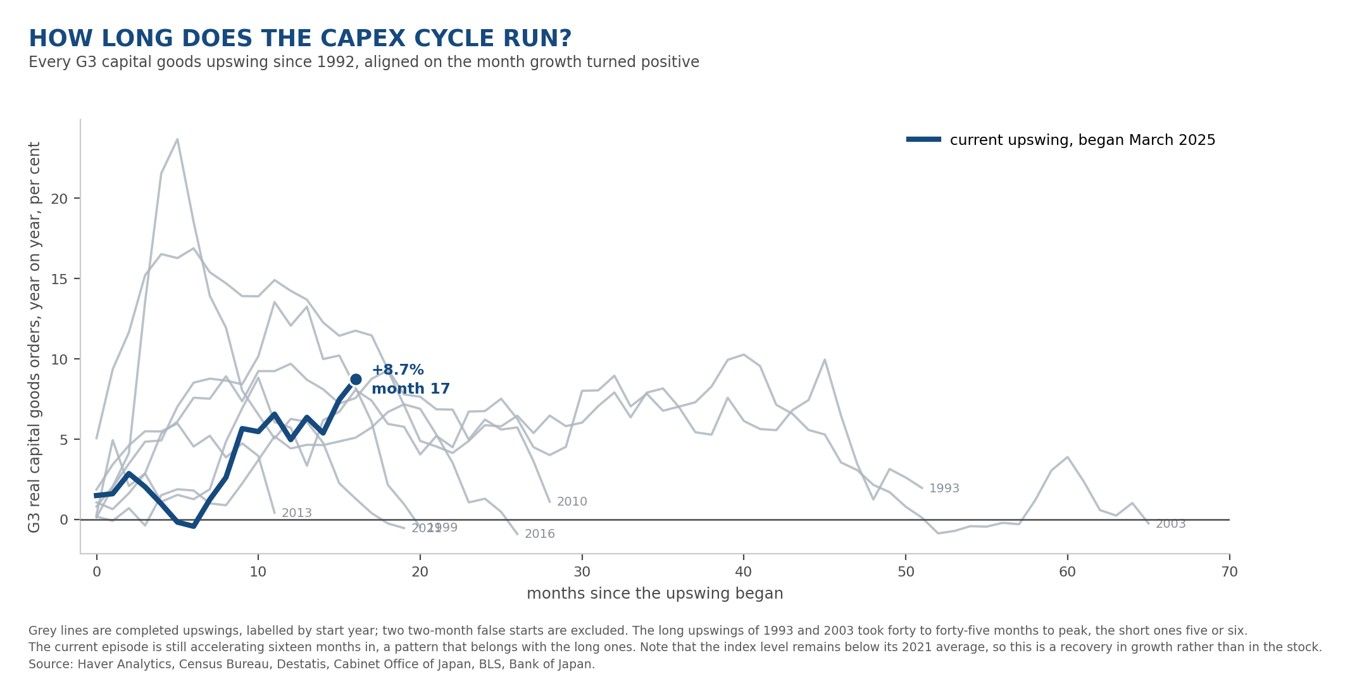
Figure 1 G3 capital-goods upswings since 1992, aligned on the month when growth turned positive. The current cycle is shown in navy. Weights: United States 0.5, Germany 0.25 and Japan 0.25, on a volume basis.
A framework for the transmission The framework below traces how a positive productivity shock can pass through an economy. Higher productivity affects unit labour costs, margins and returns on capital. Those outcomes shape inflation, investment and monetary policy, while the cost and availability of finance influence how quickly new capacity can be built. The favourable process continues while productivity gains expand effective supply faster than labour, energy and financing costs rise.
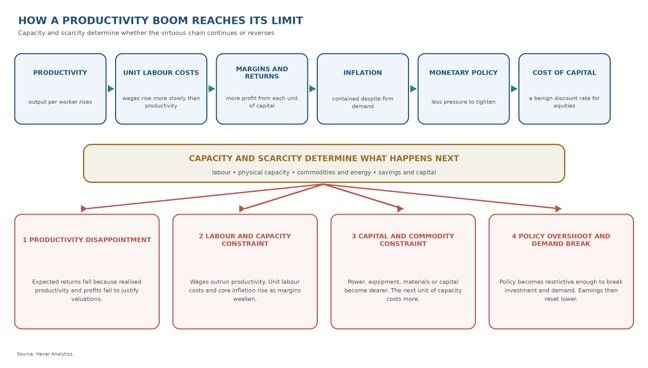
Figure 2 The transmission of a productivity shock. The initial effect can support stronger output, improved profitability and contained inflation at the same time. Capacity and scarcity determine whether that favourable process continues or reverses.
Capacity and scarcity determine where the chain goes next. Four routes matter. They may overlap, but each begins in a different place and has different implications for growth, inflation and policy.
Productivity disappointment. If realised productivity fails to justify the scale of investment, the expected supply gains do not materialise. Firms may then cut capital spending, growth slows and part of the earlier investment proves premature. This is the risk most specific to an AI-led expansion.
Labour and capacity constraint. If demand grows faster than productive capacity, wage growth can move above productivity growth. Unit labour costs and core inflation then rise as margins weaken. Central banks may shift policy in a more restrictive direction just as the supply-side benefits begin to disappoint.
Capital and commodity constraint. Productivity may remain strong, but scarce electricity, grid connections, equipment, metals, construction capacity or savings make the next unit of productive capacity more expensive. The economy can remain healthy, but the pace of investment slows and resource costs put upward pressure on inflation and real interest rates.
Policy overshoot and demand break. Central banks may respond to constraint-driven inflation by raising borrowing costs far enough to weaken investment and broader domestic demand. Capacity pressure then disappears because the economy has slowed, delaying the supply expansion that would otherwise have eased the original bottlenecks.
Evidence The evidence on corporate profits is consistent with the favourable part of this transmission. Output is rising without employment increasing at the same pace, while wage growth has lately slowed across the United States, the euro area and the UK. Higher interest rates have also cooled wages and consumer demand, so technology cannot take all the credit. Even so, profit margins have remained strikingly resilient.
US companies are earning more profit from each unit of output than at any point in the past 75 years. This does not prove that productivity is responsible, but it shows that recent output gains have not required a proportionate increase in labour costs. Capital has so far captured more of the gains than labour.
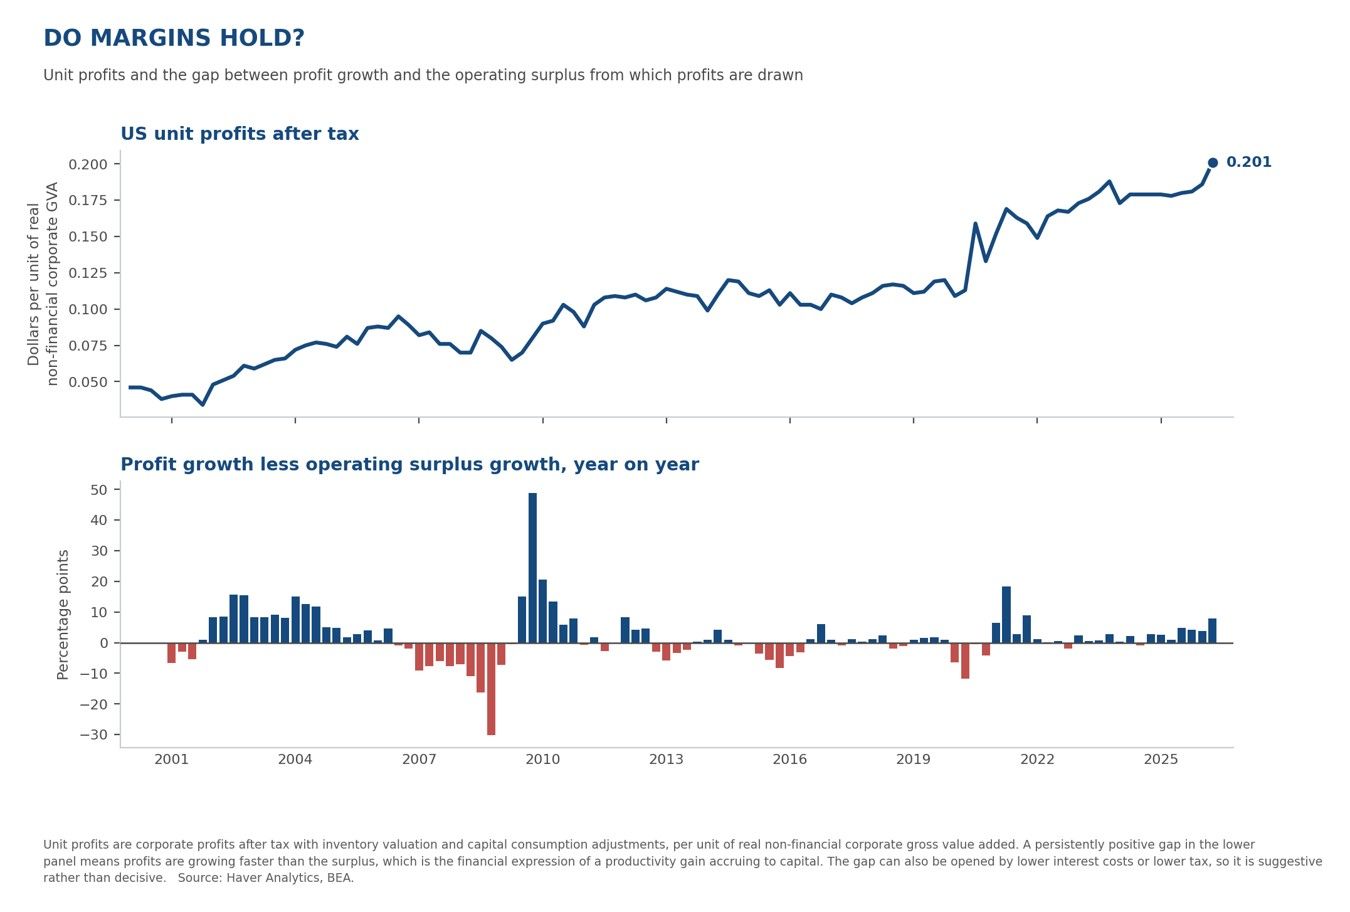
Figure 3 US profit per unit of output and the extent to which profit growth has exceeded the growth of corporate operating income overall.
The financing position is also supportive. US companies are funding most investment from cash flow rather than relying heavily on borrowing, while euro-area companies collectively continue to generate more cash than they spend. Internal finance can sustain investment even when money is expensive. It also leaves the expansion less exposed to refinancing pressure, although that advantage would fade if borrowing began to rise sharply.
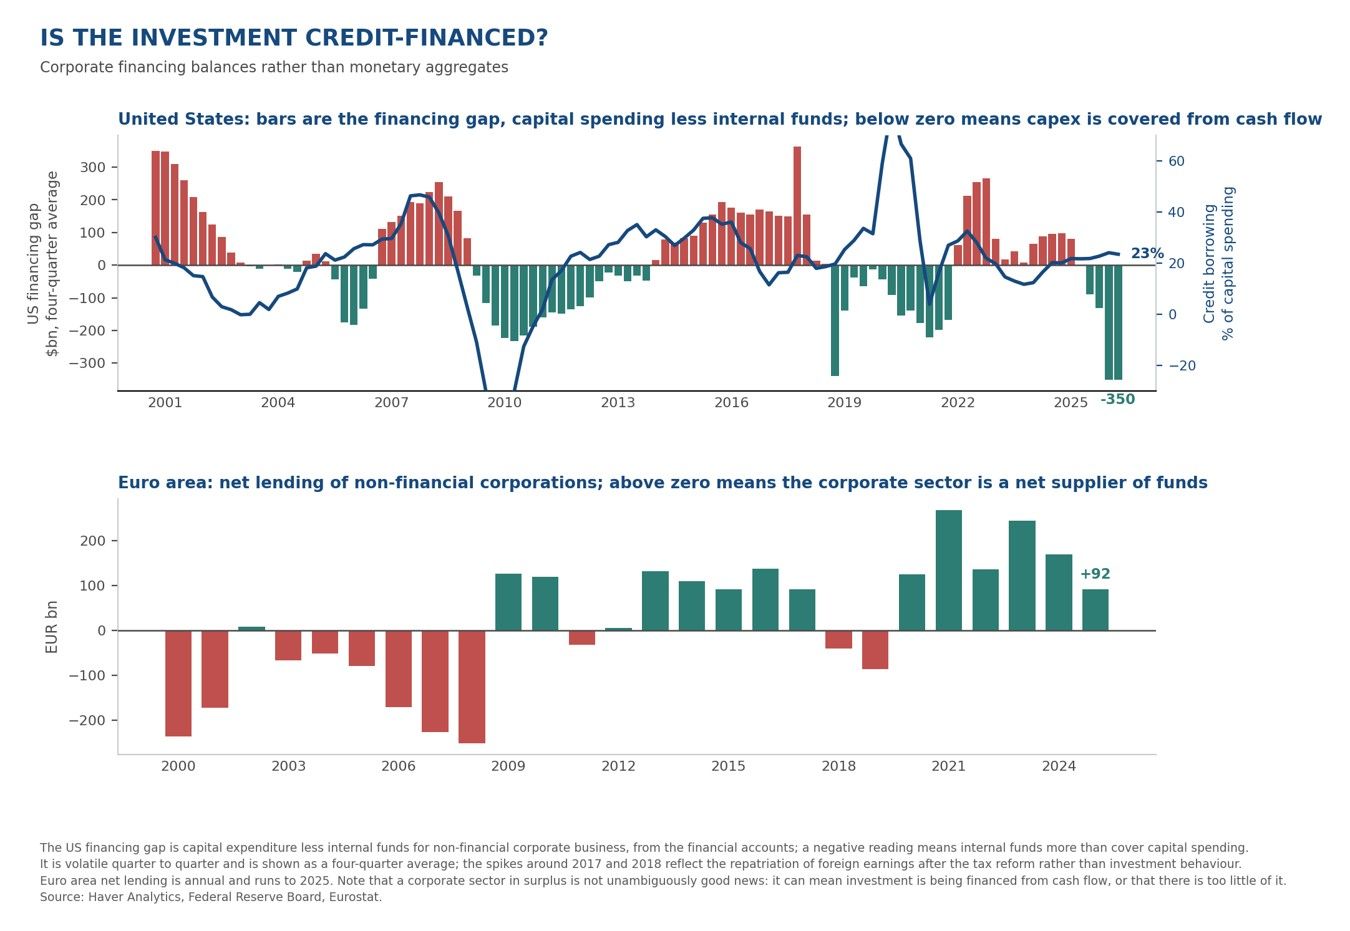
Figure 4 US business investment after allowing for internally generated funds, together with borrowing as a share of investment. The lower panel shows whether euro-area companies collectively provide funds to the rest of the economy or need to borrow from it.
The physical constraints are, however, increasingly visible. Electricity has become relatively expensive in the US regions with the largest concentrations of data centres. Copper, uranium and other inputs linked to electrification have strengthened. Climate policies are also bringing forward demand for grids, storage and transition metals before new capacity is ready, while tighter immigration policies are limiting the construction and engineering labour needed to build it.
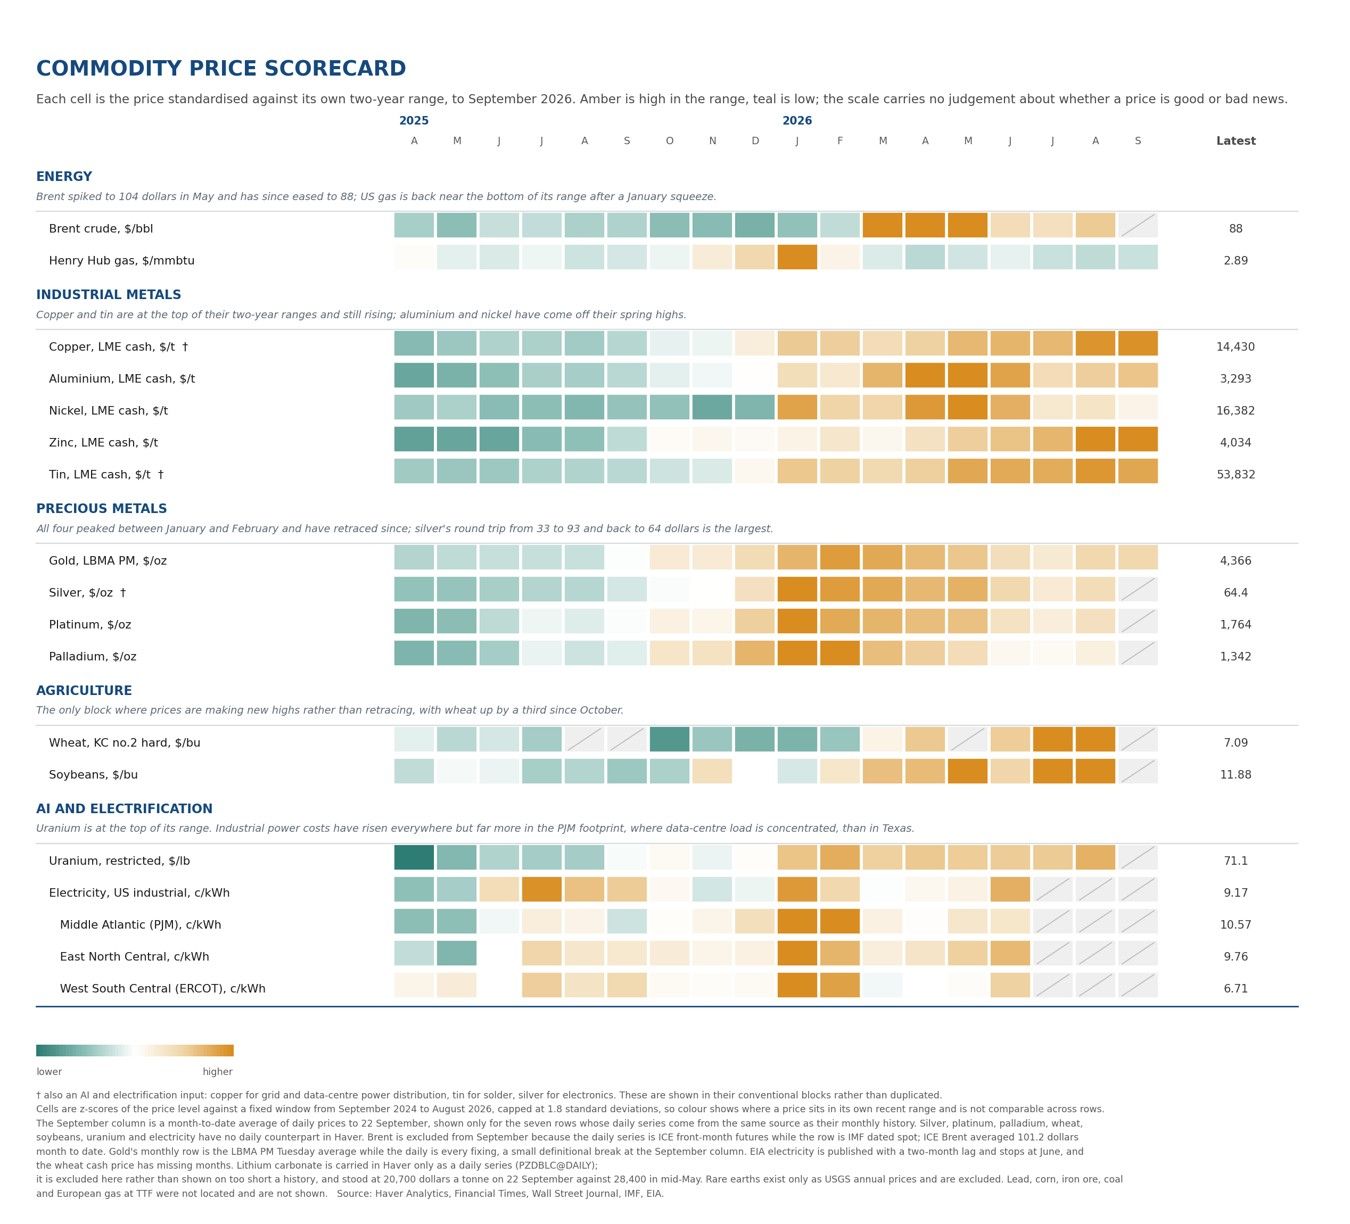
Figure 5 Commodity prices relative to their two-year ranges, with separate measures for inputs associated with AI and electrification. The regional comparison shows industrial electricity costs in US data-centre regions against Texas.
Policy is the final link. Higher interest rates cannot create electricity, copper or skilled labour, but central banks cannot ignore cost increases that spread into wages and broader prices. Historically, rising order backlogs and slower supplier deliveries have been followed by tighter policy. Those pressures are now increasing again in the United States and the euro area.
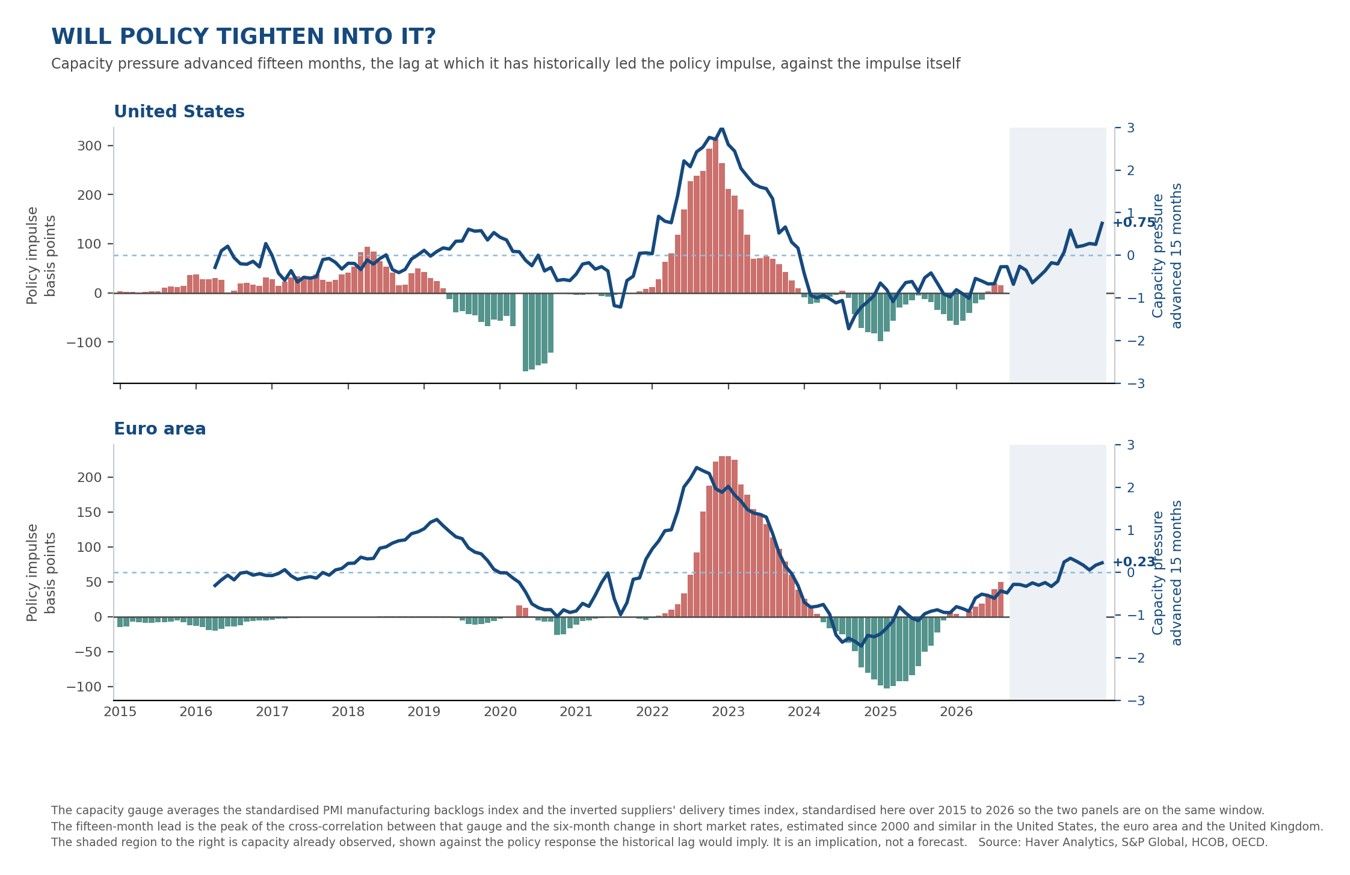
Figure 6 The blue lines show pressure on productive capacity fifteen months earlier; the bars show subsequent central-bank tightening or easing. The shaded area applies the historical lag to capacity pressure already observed. It illustrates the policy risk rather than forecasting future rate decisions.
What to watch The most useful indicators follow the transmission chain. Realised productivity and unit labour costs show whether the technology is delivering. Profit per unit of output and broader margins show whether firms are converting those gains into higher returns on capital. Commodity prices and electricity costs reveal whether scarcity is raising the cost of new capacity, while corporate borrowing and real interest rates show whether finance is becoming a constraint.
The clearest warning would be slowing productivity, accelerating unit labour costs and weaker margins alongside persistently restrictive monetary policy. A sharp rise in corporate borrowing would suggest that the expansion had begun to depend on credit rather than cash flow. A collapse in orders or investment after policy tightened would show that a demand break was already under way. Followed link by link, the US chain is currently intact at the front but showing more pressure at the back.
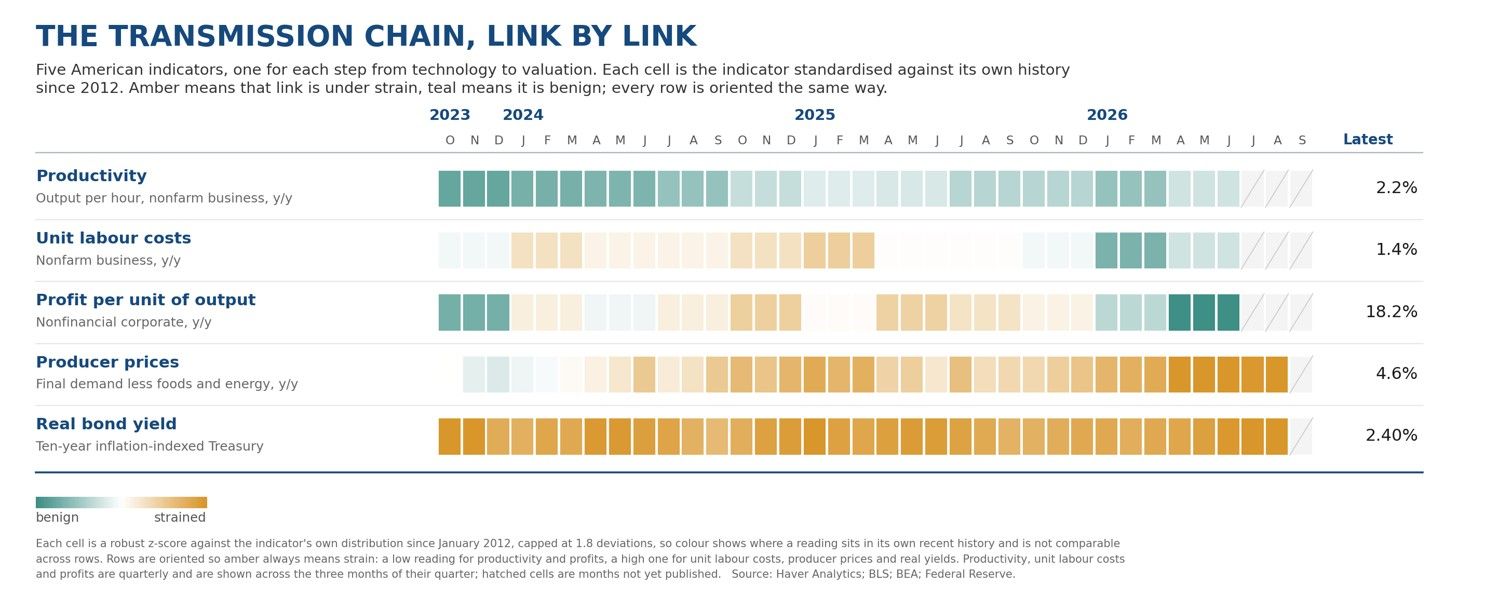
Figure 7 Five US indicators, one for each step of the transmission chain, each standardised against its own history since 2012. Amber marks a link under strain and teal a benign one, with every row oriented in the same direction.
Implications for growth and policy The effects extend well beyond the technology sector. Greater use of artificial intelligence requires additional power generation, grid capacity, cooling systems, electrical equipment and industrial metals. These industries form part of the same investment cycle. How quickly they expand will help determine whether AI raises economy-wide productivity or encounters a persistent physical bottleneck.
The policy implications are equally important. Monetary policy must distinguish between demand that is running ahead of capacity and investment that is expanding capacity. Central banks still need to prevent higher energy and material costs from feeding into wages and broader inflation. Fiscal and structural policies can help by improving grid connections, permitting, infrastructure, training and the predictability of energy policy.
The overall conclusion is conditional. The favourable phase can continue while productivity improves, unit labour costs remain contained and investment is largely financed from internal cash flow. The risks become more pronounced if productivity weakens at the same time as resource and financing costs rise. The durability of the boom will therefore depend not only on the capabilities of AI, but on how quickly the physical economy and public policy adapt around it.
Sources: Haver Analytics; US Census Bureau; Destatis; Japan Cabinet Office; BLS; BEA; Federal Reserve; Dallas Fed; Eurostat; ONS; OECD; S&P Global.

Andrew Cates
AuthorMore in Author Profile »Andy Cates joined Haver Analytics as a Senior Economist in 2020. Andy has more than 25 years of experience forecasting the global economic outlook and in assessing the implications for policy settings and financial markets. He has held various senior positions in London in a number of Investment Banks including as Head of Developed Markets Economics at Nomura and as Chief Eurozone Economist at RBS. These followed a spell of 21 years as Senior International Economist at UBS, 5 of which were spent in Singapore. Prior to his time in financial services Andy was a UK economist at HM Treasury in London holding positions in the domestic forecasting and macroeconomic modelling units. He has a BA in Economics from the University of York and an MSc in Economics and Econometrics from the University of Southampton.