

 Global| Sep 22 2026
Oil: Running Out of Slack
by:Andrew Cates
|in:Viewpoints
Brent crude traded near $70 a barrel when the Strait of Hormuz closed at the end of February. It reached $138 in April and has since retraced part of that move while remaining well above its pre-disruption level. The macroeconomic response has so far been modest. Consensus forecasts for world output in 2026 have been revised down, but only very modestly.
The natural interpretation is that the structural sensitivity of output to energy prices has fallen, through lower energy intensity, more flexible product and labour markets, and better-anchored inflation expectations. There is something in each of these. But the evidence points to a more contingent explanation. The adjustment has been accommodated principally on the inventory margin rather than through quantity rationing or demand destruction, and the capacity to continue accommodating it that way is close to exhausted.
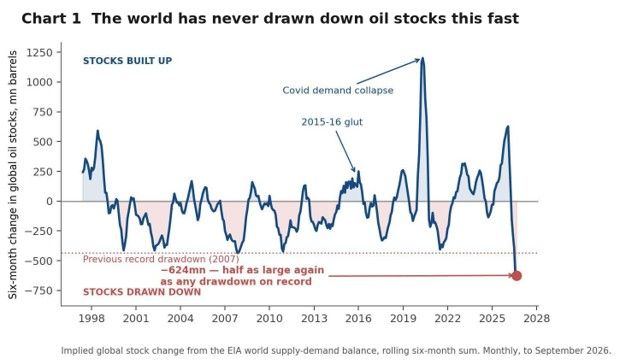
Implied global stock changes, derived from the EIA's world supply-demand balance, show a cumulative six-month drawdown roughly half as large again as the previous maximum in 2007. The initial condition matters here. Stocks were being accumulated rapidly through late 2025, so the disruption arrived with storage unusually full; the buffer was the incidental product of a preceding surplus rather than the result of deliberate precautionary accumulation. Commercial cover across the OECD has since fallen to around twenty-one days, and non-OECD buyers have begun to draw down the precautionary holdings built in the spring.
Sources: US Energy Information Administration and Haver Analytics
The binding constraint is midstream and downstream However, the composition of this data is more informative than its level. The disruption has operated less on upstream supply than on the capacity to refine crude and to transport it. Houthi forces hold positions commanding the approaches to Bab el-Mandeb, and an attack attributed to Iran-aligned militias has damaged the Saudi east-west pipeline, which exists specifically to allow Saudi exports to bypass Hormuz. The system is therefore losing not only capacity but the alternatives to it. That is the more serious loss. Spare routes and spare refining are what allow a disruption in one place to be absorbed elsewhere; without them, each new attack does more damage than the last.
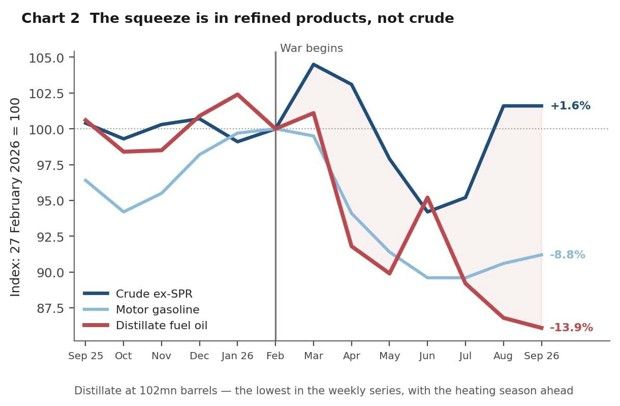
The US weekly series provide the highest-frequency observation of the resulting product imbalance, and the pattern is not specific to the United States. Crude stocks excluding the strategic reserve are down only a few per cent from their late-February level. Motor gasoline has fallen by rather more. Distillate has fallen by close to fourteen per cent, to approximately 102m barrels, the lowest reading in the weekly series, with the northern hemisphere heating season ahead. Middle distillate is the binding link in the global fuel chain: it is the input to freight, agriculture, construction and industrial process heat, and its demand is among the least price-elastic in the barrel. Europe, structurally short of diesel and dependent on import routes transiting the Red Sea, faces the same imbalance with less domestic refining slack.
Sources: US Energy Information Administration and Haver Analytics
For applied work this argues against treating Brent as a sufficient statistic for the shock. Product cracks, refinery utilisation rates, days of cover and freight rates identify the transmission channel more precisely, and they have been signalling greater stress than the crude benchmark throughout.
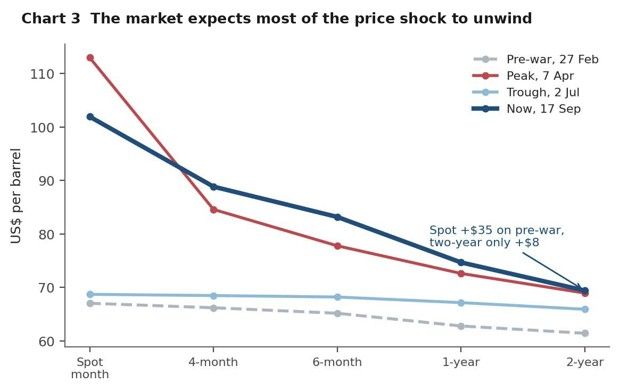
What the forward curve implies Markets have taken a clear view, and it is worth spelling out. Prices for oil delivered today have risen a long way, while prices for delivery in two years' time have barely moved. Buyers are paying a large premium for barrels they can have now rather than later, which tells us two things: that physical supply is genuinely tight, and that the market expects the disruption to pass.
Sources: CME and Haver Analytics
Markets may well be right. Talks have picked up, and expensive fuel is politically costly for everyone involved. But the view sits awkwardly beside empty storage tanks, continuing attacks on energy infrastructure and the loss of the routes that used to provide a way round a blockage. It may also work against itself. Oil companies deciding whether to develop new fields look at the price years ahead, not today's, and a market that says the current price will not last is telling them not to bother — which is what keeps supply short.
Three relationships that have changed Cross-country evidence since February points to three changes in the transmission of oil prices to asset markets, none of which is specific to a single economy.
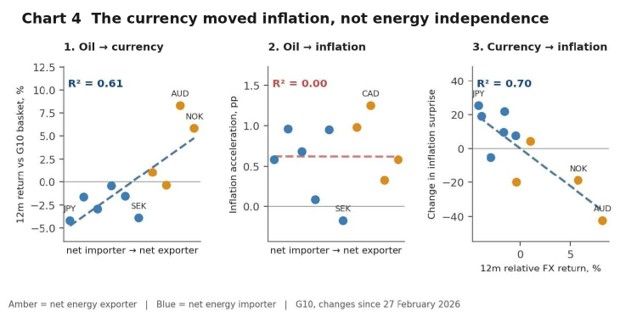
The first concerns the exchange rate channel. A terms-of-trade shock of this kind redistributes real income from importers to exporters rather than destroying it, which is why the initial forecast revisions differentiated between the two. In the event the propensity to spend out of the windfall has been low, accruing as it has to corporate profits, fiscal revenues and sovereign funds. Domestic production has also provided little insulation from domestic inflation, since refined products clear in world markets irrespective of the origin of the crude. The variable that has re-squared the outcomes is the nominal exchange rate: economies with appreciating currencies imported the shock at a lower domestic price and have recorded smaller inflation surprises. For empirical work this suggests that conditioning on net energy trade balances, the conventional approach, has been less informative this cycle than conditioning on currency performance.
Sources: Citigroup, LSEG, World Bank, national statistics and Haver Analytics
The second concerns short-dated bond yields. Before the pandemic, a rising oil price was taken as a sign of stronger global demand, and yields at the front of the curve barely moved in response. That has changed. Short-dated yields in the major markets now track crude closely. Investors are reading a higher barrel as a statement about inflation, and about how central banks will respond to it, rather than as a signal that demand is strong. One caveat: oil prices and yields are both reacting to the same conflict news, so this describes how markets are behaving now rather than a relationship that can be relied on to persist.
The third has had the least attention. The expectation would be that this hurts some markets more than others. The US index is dominated by companies whose value rests on profits expected far in the future, and those are the most sensitive to higher interest rates; markets elsewhere carry more energy, mining and banking shares, and should therefore stand up better when oil rises. The data say otherwise. The correlation with Brent is about equally negative for the S&P 500 and for the MSCI World ex-USA index in local currency, and the two have moved together rather than apart.
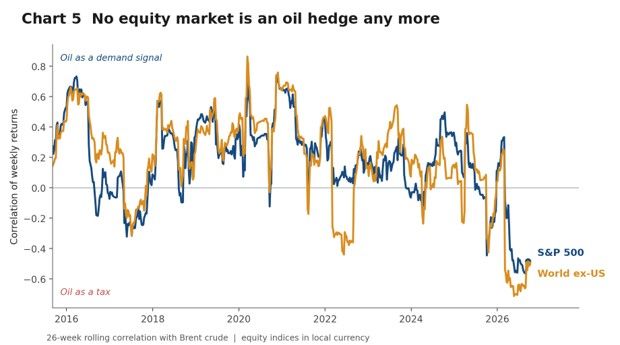
Sources: LSEG, MSCI, EIA and Haver Analytics
That similarity is itself the result worth noting. If the damage were coming from what each market holds, the two would have parted company. They have not, which points to something common to all of them: higher oil raises expected inflation, that raises expected interest rates, and that lowers the value placed on future profits wherever those profits are earned. The practical consequence is that spreading equity holdings across countries does not reduce a portfolio's exposure to the oil price.
The policy problem is broader than oil A final consideration bears on the inflation outlook. The energy disturbance is not occurring in isolation. Grain markets have carried an elevated risk premium since 2022; the capital expenditure cycle associated with artificial intelligence, alongside rearmament, has raised demand for copper, aluminium and energy-transition metals; and the WMO issued an El Niño advisory in June which has already been reflected in tropical soft commodity prices. Measured from February, crude has recorded the largest increase, but cereals, beverages, coal and agricultural raw materials have all risen materially, and the correlation between these moves is low because their proximate causes are unrelated.
This distinction matters for policy. An isolated relative price change has a one-off effect on the price level, and looking through it is defensible provided expectations remain anchored. A sequence of unrelated supply disturbances, each entering the annual comparison before the previous one has dropped out, generates a persistently elevated headline rate that is observationally difficult to separate from a genuine inflation process, both for the central bank and for the households and firms whose expectations it is attempting to anchor.
Whether restrictive policy is the appropriate instrument in these circumstances is a legitimately open question, given that higher policy rates raise financing and housing costs that themselves enter the price index, and that survey measures of household inflation expectations frequently respond perversely to rate increases. That debate is beyond the scope of this note. The narrower point stands: the distribution of inflation outcomes is wider than an energy shock alone would generate, and weaker activity is unlikely on its own to deliver rapid policy relief.
The six months since February have revealed how little redundancy the system carried: in storage, in refining capacity, in export routing. The adjustment to date has been financed out of those buffers. They are close to depleted.
Notes on the data Chart 1. Implied global stock change derived from the EIA's world supply-demand balance, expressed as a rolling six-month sum. The series is the residual between estimated world supply and estimated world demand and therefore embeds the measurement error in both; individual monthly observations should be treated with caution. Signs are presented so that a decline in stocks is plotted downwards. Available in Haver's ENERGY and USENERGY databases, which carry the EIA world liquid fuels supply and consumption balance (for example SWONOKT9 and RWONOKT9); OPEC and Energy Intelligence equivalents are in ENERGY and OMI respectively.
Chart 2. US data only. As the United States is a net exporter of refined products, these series may understate product tightness in importing regions. Available in Haver's USENERGY database (EIA weekly ending stocks; US crude excluding the SPR is DUSFLAB), with parallel series in WEEKLY.
Chart 3. Forward prices represent market expectations under the risk-neutral measure and are not point forecasts. The spot-forward spread can move sharply with supply conditions and risk premia. Available in Haver's DAILY database (CME light sweet crude contract settlements, for example PZTEXFY and PZTEXFB) and in USENERGY, which carries the NYMEX contract positions (DCLR01S through DCLR12S).
Chart 4. Energy exposure is net energy imports as a percentage of energy use, World Bank, 2023. Currency returns are measured against an equal-weighted G10 basket, and changes are measured from 27 February 2026. Inflation surprise is the Citigroup index. Available in Haver’s DAILY database for exchange rates, SURVEYS for the Citigroup inflation surprise indices, and the national CPI databases for the inflation rates.
Chart 5. Rolling 26-week correlations of weekly log returns between Brent crude (PEBRT@DAILY) and, respectively, the S&P 500 (SP500@DAILY) and the MSCI World ex-USA GDP-weighted share price index in local currency (WXUGPL@MSCID). Local-currency terms are used so that the comparison isolates equity behaviour from dollar movements; the ex-US index is GDP-weighted rather than capitalisation-weighted, which raises its non-technology weight and if anything strengthens the result. Rolling correlations adjust slowly to regime change, and the informative feature is the absence of a gap between the two series rather than the level of either. Available in Haver's DAILY database for Brent and the S&P 500, and MSCID for the MSCI equity indices.
Commodity comparisons in the final section use IMF world commodity price sub-indices, February to August 2026. Available in Haver's IFS database (crude oil C001CXSA, coal C001CXCL, base metals C001CXM2, energy transition metals C001CXET, food C001CXF2, beverages C001CXB2, cereals C001CXCE and agricultural raw materials C001CXA2).

Andrew Cates
AuthorMore in Author Profile »Andy Cates joined Haver Analytics as a Senior Economist in 2020. Andy has more than 25 years of experience forecasting the global economic outlook and in assessing the implications for policy settings and financial markets. He has held various senior positions in London in a number of Investment Banks including as Head of Developed Markets Economics at Nomura and as Chief Eurozone Economist at RBS. These followed a spell of 21 years as Senior International Economist at UBS, 5 of which were spent in Singapore. Prior to his time in financial services Andy was a UK economist at HM Treasury in London holding positions in the domestic forecasting and macroeconomic modelling units. He has a BA in Economics from the University of York and an MSc in Economics and Econometrics from the University of Southampton.