FRBNY Empire State Manufacturing Index Slipped Slightly in February
by:Sandy Batten
|in:Economy in Brief
Summary
- The headline index edged down to 7.1 from 7.7 in January but continued to point to expansion.
- New orders slowed slightly while shipments plunged 17 points into negative territory.
- Prices paid and received both rebounded in February.
- Expected capital expenditures rose to a three-year high.
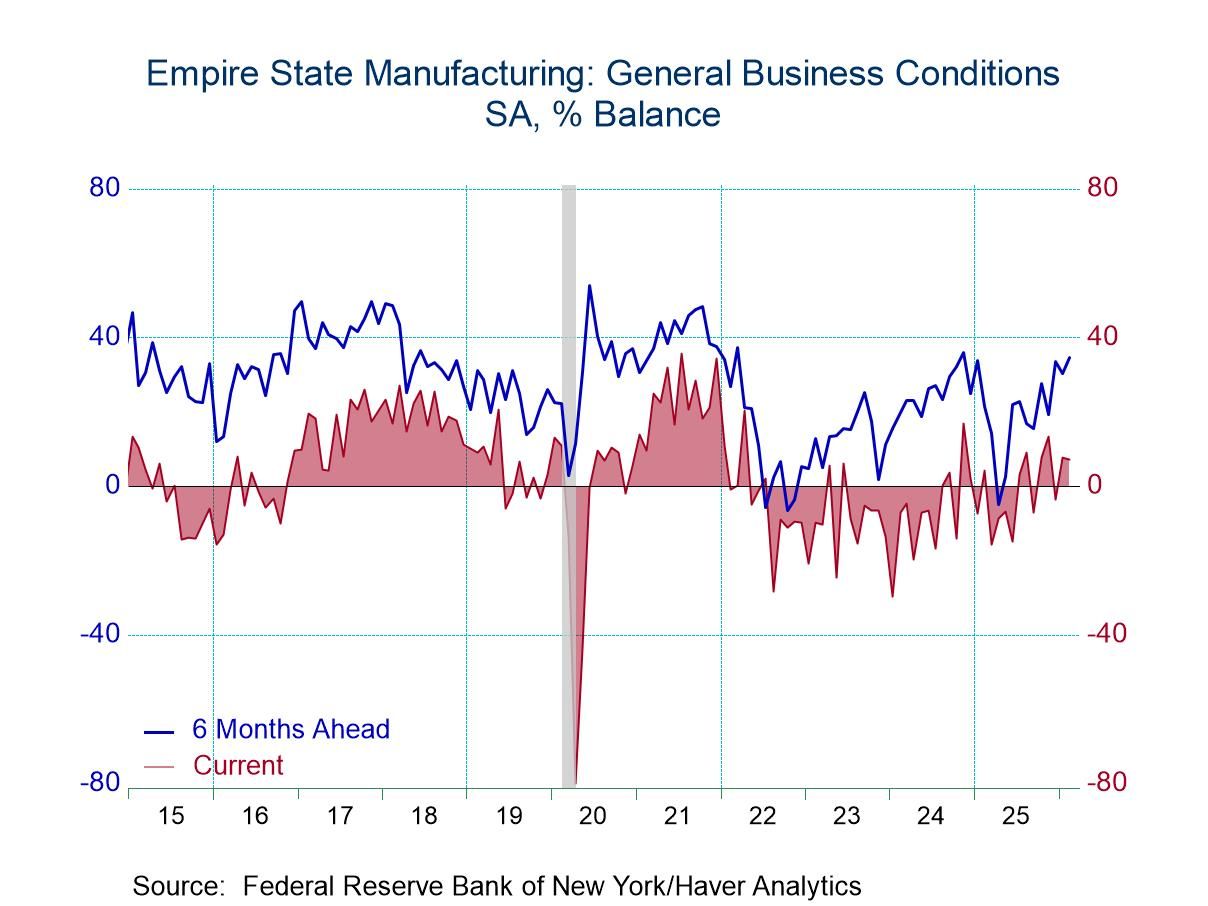
The Empire State Manufacturing Index of General Business Conditions slipped to 7.1 in February from 7.7 in January, according to the Empire State Manufacturing Survey released by the Federal Reserve Bank of New York. A reading of 8.0 for February had been expected by the Action Economics Forecast Survey. The positive February figure indicated that the business activity in the New York Fed district expanded for the fourth time in the past five months, though at a slightly slower pace than in January. The percentage of respondents reporting an increase in general business conditions rose to 36.0% in February from 34.2% in January and 31.7% in December; the percentage reporting a decrease increased to 28.9% in February from 26.5% in January but down from 35.4% in December. The latest survey was conducted between February 2 and February 9.
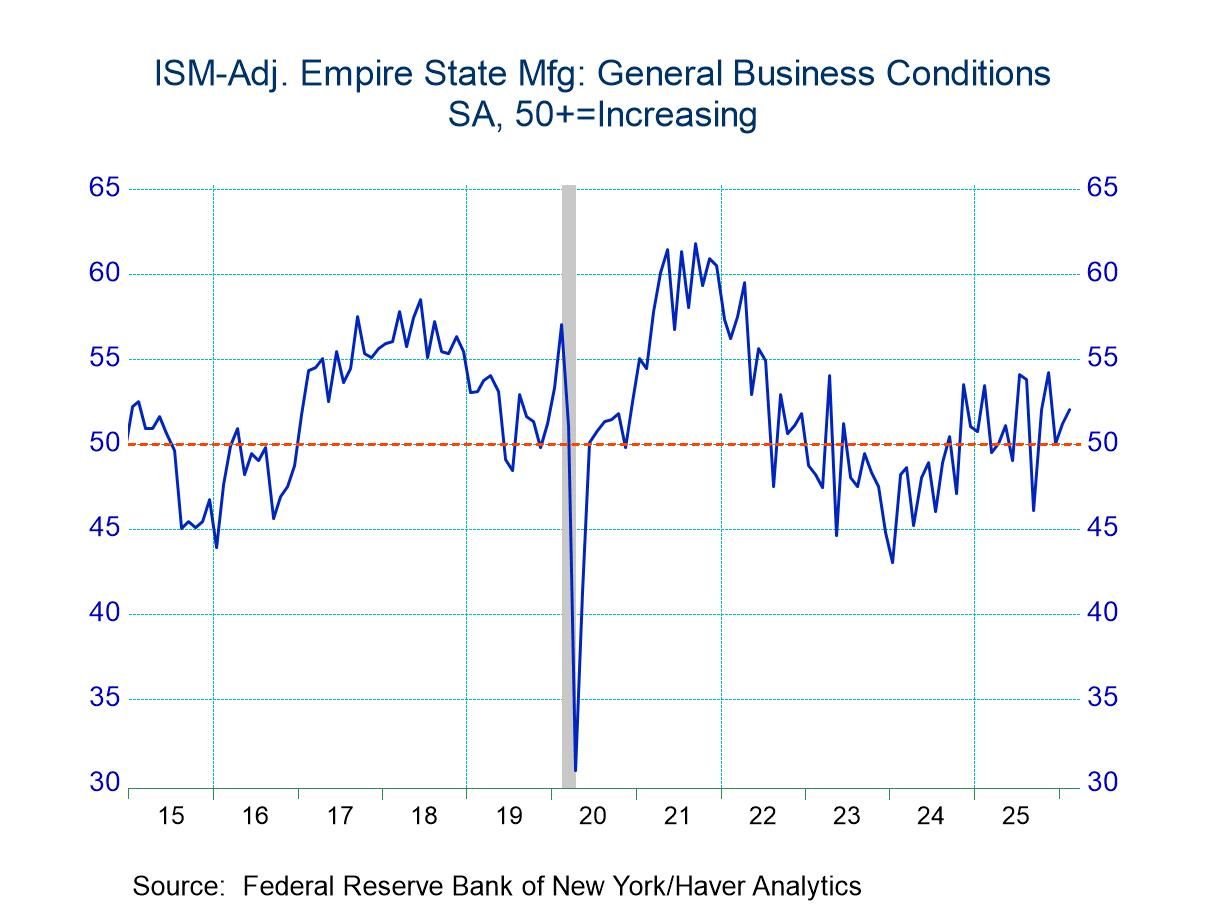
The headline index reflects the answer to a single question concerning the state of economic activity and is not calculated from the components. Haver Analytics calculates a composite index from the five major components, which is comparable to the ISM manufacturing index. In contrast to the small decline in the headline index, the ISM counterpart index increased to 52.0 in February, the highest reading since November, from 51.2 in January, indicating that the pace of economic activity picked up slightly in February. The ISM counterpart index is the average of five diffusion indexes: new orders, shipments, employment, supplier deliveries and inventories with equal weights (20% each).
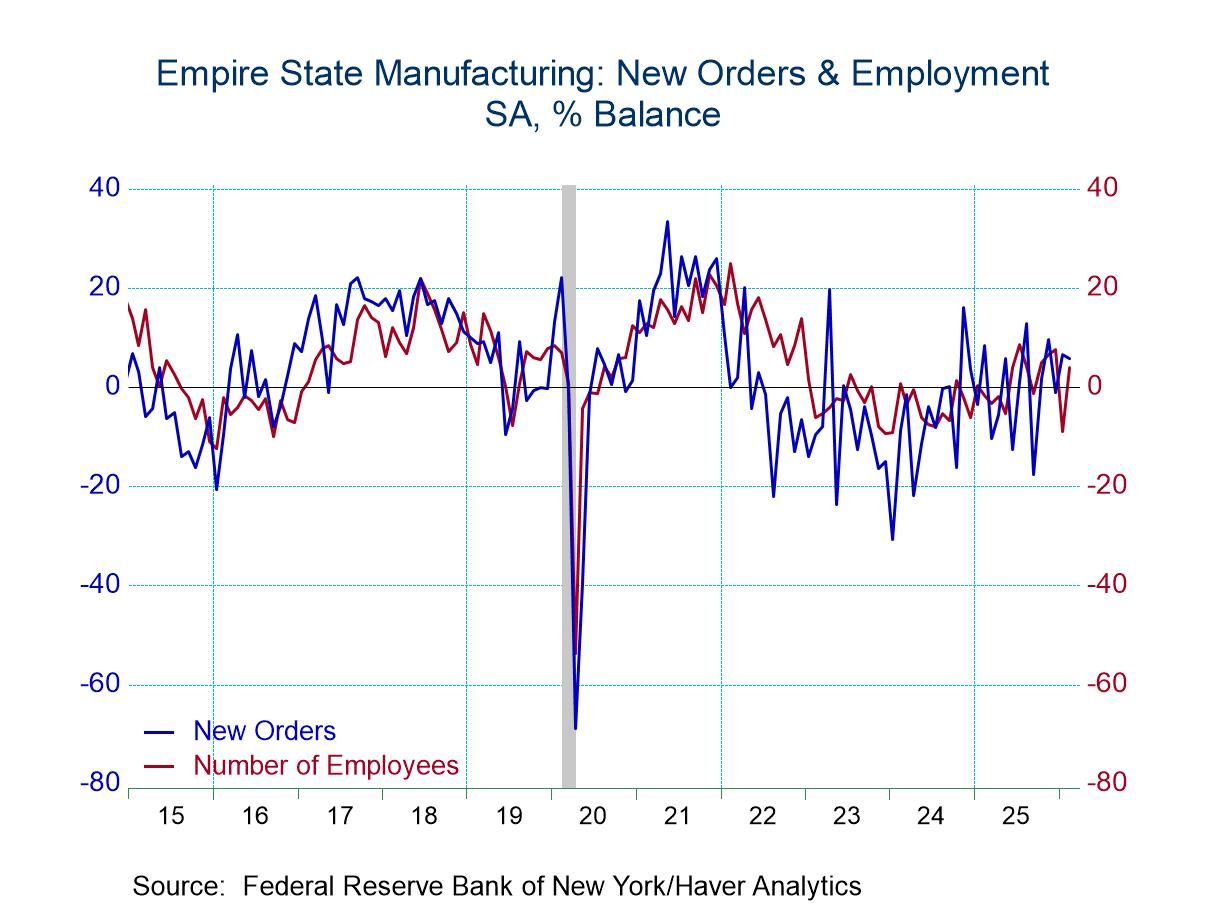
In the latest survey, the new orders index came in at 5.8, pointing to an ongoing increase in orders in February, though this was down from 6.6 in January. The shipments index dropped seventeen points to -1.0, indicating shipments were little changed in February. Twenty-seven percent of respondents reported an increase in shipments, down from 39% in January while 28% reported a decrease, up from 22% in January. The unfilled orders index rose 17 points to 9.1, and delivery times were slightly longer. Inventories rose. The supply availability index came in at -1.0, suggesting supply availability was little changed in February, up from -4.1 in January.
On the labor front, the labor market indicators rebounded into positive territory in February. The number of employees index increased to 4.0 from -9.0 in January. Sixteen percent of respondents reported an increase in employment, up from 7.9% in January, while 11.8% reported a decrease, down from 16.8% in January. The average workweek index rose to 2.1 in February from -5.4 in January.
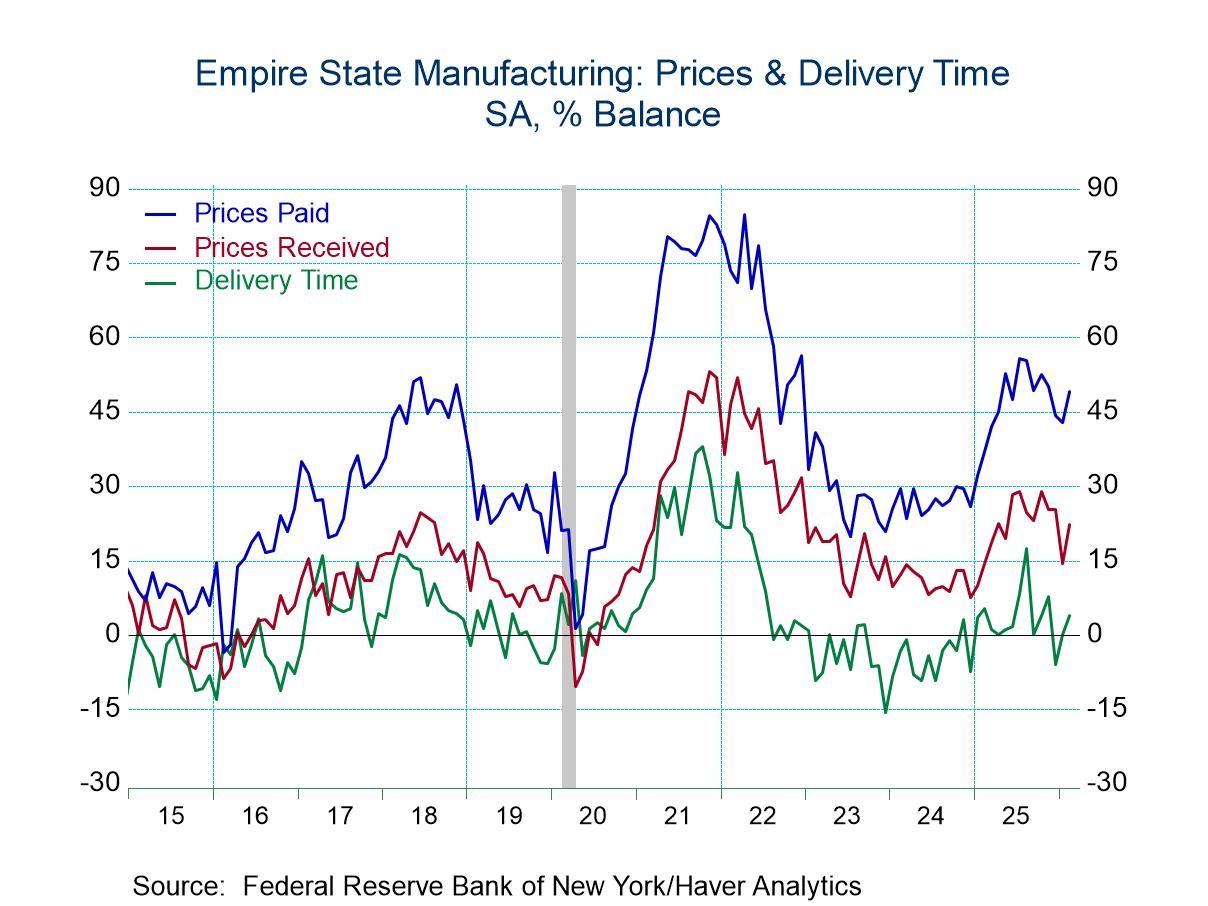
Inflation pressures intensified somewhat in February. The prices paid index rose to 49.1 in February, its highest reading in three months, from 42.8 in January. Fifty percent of respondents reported paying higher input prices in February, up from 44.5% in January, while only 1.2% reported paying lower input prices versus 1.7% in January. The prices received index jumped to 22.2 in February from 14.4 in January. Twenty-eight percent of respondents reported receiving higher prices, up from 18.9% in January, while 6.1% reported receiving lower prices, up from 4.4% in January. February readings for both indexes are well below those in late 2021 and early 2022 when general inflation soared but are meaningfully higher than in 2024.
Firms continued to be optimistic about the outlook. The index for future business conditions rose four points to 34.7, its highest reading since November 2024. New orders and shipments are expected to increase, and employment is expected to grow. The capital expenditures index rose eight points to 18.2, its highest reading since February 2023, indicating a marked strengthening in capital spending plans.
The indexes in this report are diffusion indexes and measure the percentage of respondents indicating an increase minus the percentage indicating a decrease with zero separating expansion from contraction.
The New York Fed survey data are contained in Haver’s SURVEYS database. The expectations series is in Haver’s AS1REPNA database.

Sandy Batten
AuthorMore in Author Profile »Sandy Batten has more than 30 years of experience analyzing industrial economies and financial markets and a wide range of experience across the financial services sector, government, and academia. Before joining Haver Analytics, Sandy was a Vice President and Senior Economist at Citibank; Senior Credit Market Analyst at CDC Investment Management, Managing Director at Bear Stearns, and Executive Director at JPMorgan. In 2008, Sandy was named the most accurate US forecaster by the National Association for Business Economics. He is a member of the New York Forecasters Club, NABE, and the American Economic Association. Prior to his time in the financial services sector, Sandy was a Research Officer at the Federal Reserve Bank of St. Louis, Senior Staff Economist on the President’s Council of Economic Advisors, Deputy Assistant Secretary for Economic Policy at the US Treasury, and Economist at the International Monetary Fund. Sandy has taught economics at St. Louis University, Denison University, and Muskingun College. He has published numerous peer-reviewed articles in a wide range of academic publications. He has a B.A. in economics from the University of Richmond and a M.A. and Ph.D. in economics from The Ohio State University.
More Economy in Brief
U.K. Headline and Core Inflation Rates Slow Sequentially as BOE Gets Ready to Meet
 Global