February PPI: Troubling Inflation Figures
Summary
- The volatile food and energy components jumped...
- ...But other items also showed upward pressure.
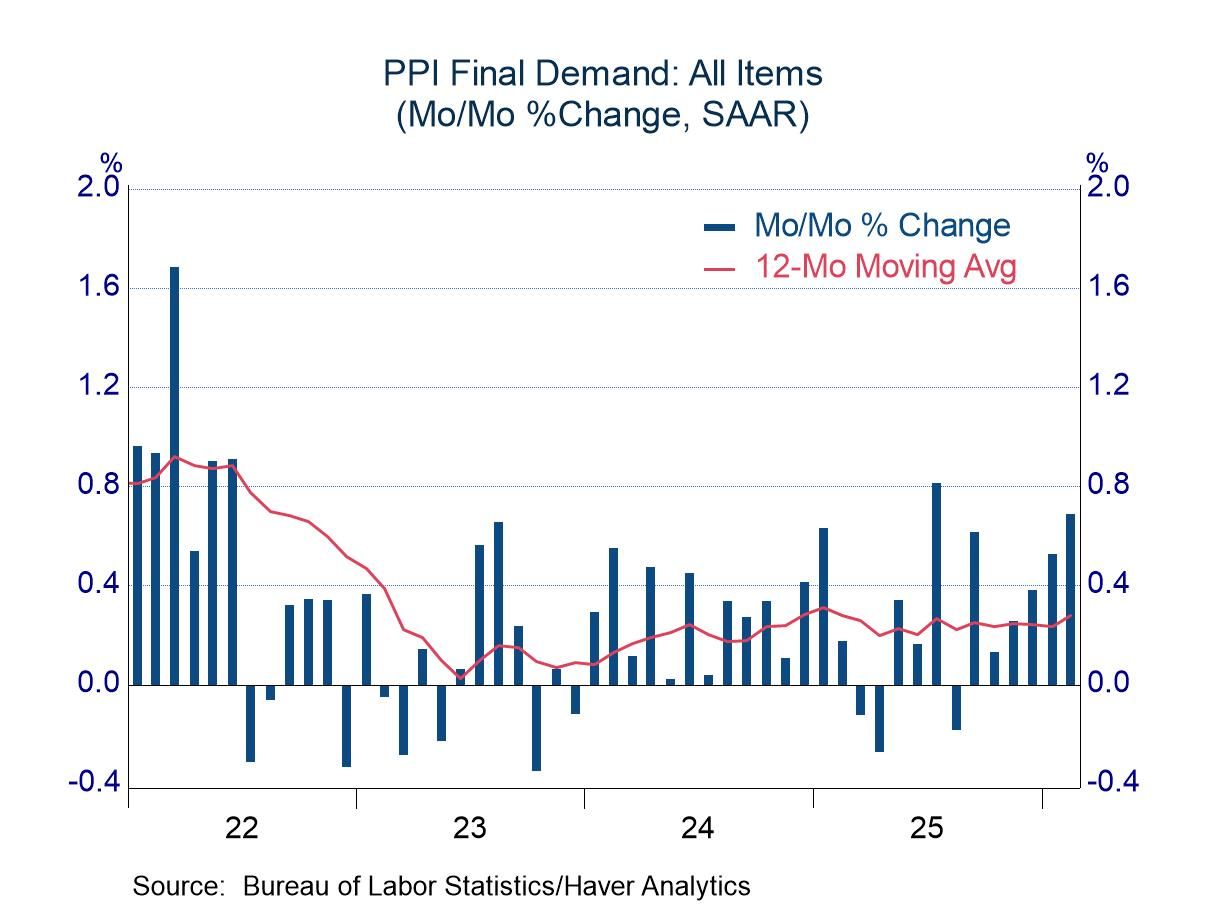
The producer price index for February rose 0.7%, decidedly faster than the expected increase of 0.3%. The latest change followed noticeable increases in the prior three months, leaving a picture of a burgeoning upward trend. The year-over-year increase totaled 3.4%, a reading near the top of the recent range.
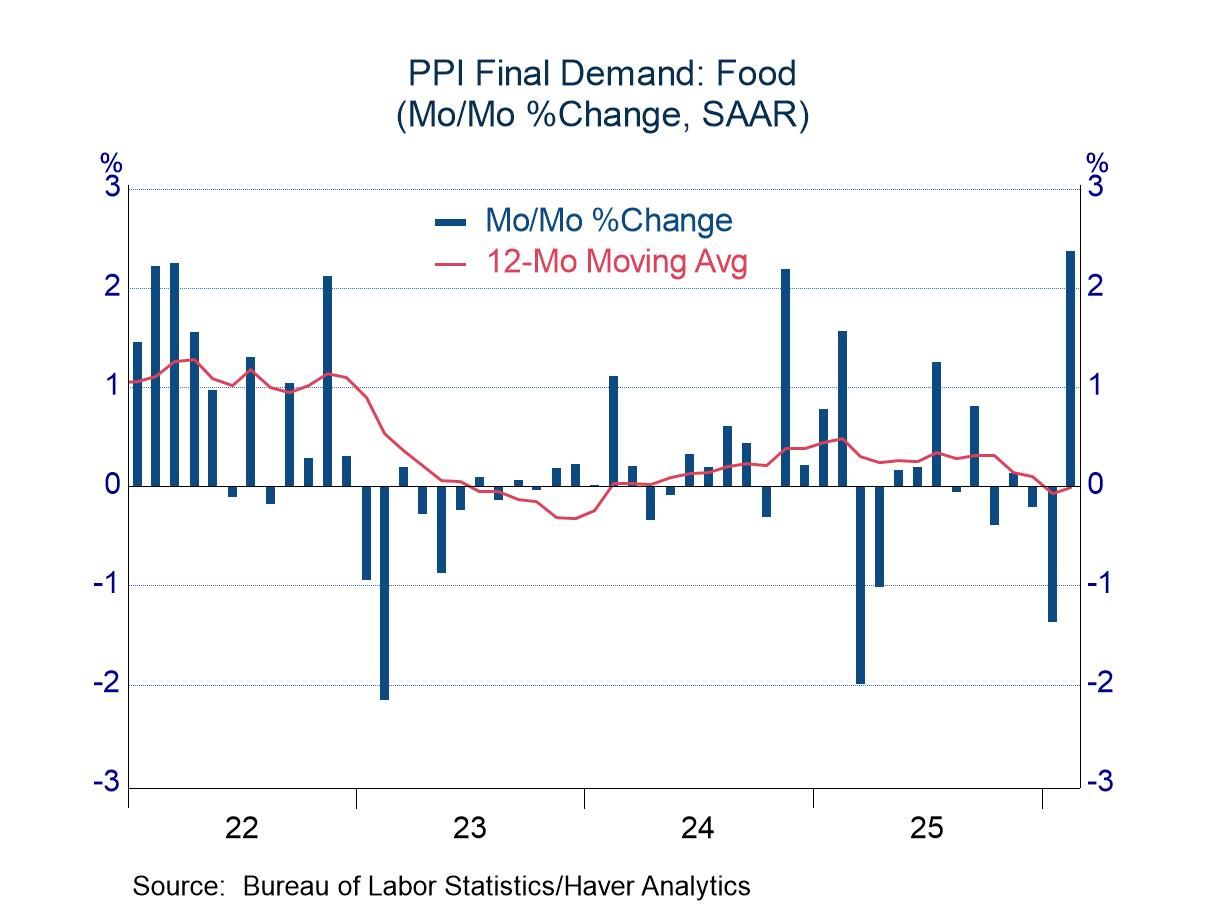
Some of the surge in February was the result of sharp increases in the food and energy components, and their jumps might be attributed to normal random volatility. For example, the surge of 2.4% in food prices could be viewed as an offset to a drop of 1.4% in the prior month; food prices in the past 12 months are down 0.2% despite the February jump. Energy prices also are down on a year-over-year basis (-0.8%) despite a surge of 2.3% in February.
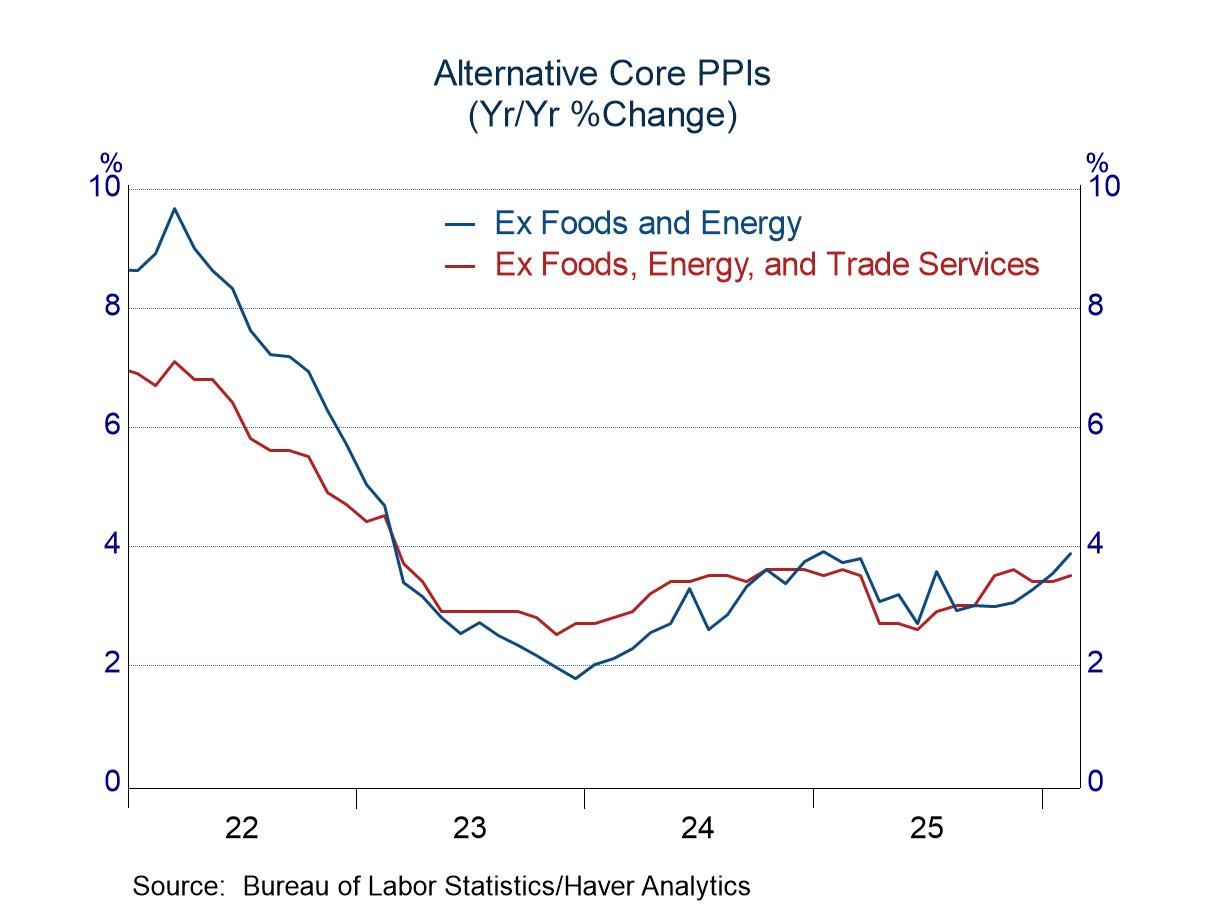
However. more than random volatility was in play in February (and other recent months), as core measures also have stirred. Prices excluding food and energy rose 0.5% in February, matching the average advance in the prior three months. The Bureau of Labor Statistics avoids the use of the term “core” inflation, but it offers another measure designed to smooth the effects of prices that often move erratically (prices excluding food, energy, and trade services). The preferred measure of the BLS also rose 0.5 percent in February after an average increase of 0.3% in the prior three months. The traditional measure of core inflation rose 3.9% on a year-over-year basis, while the BLS measure advanced 3.5%.
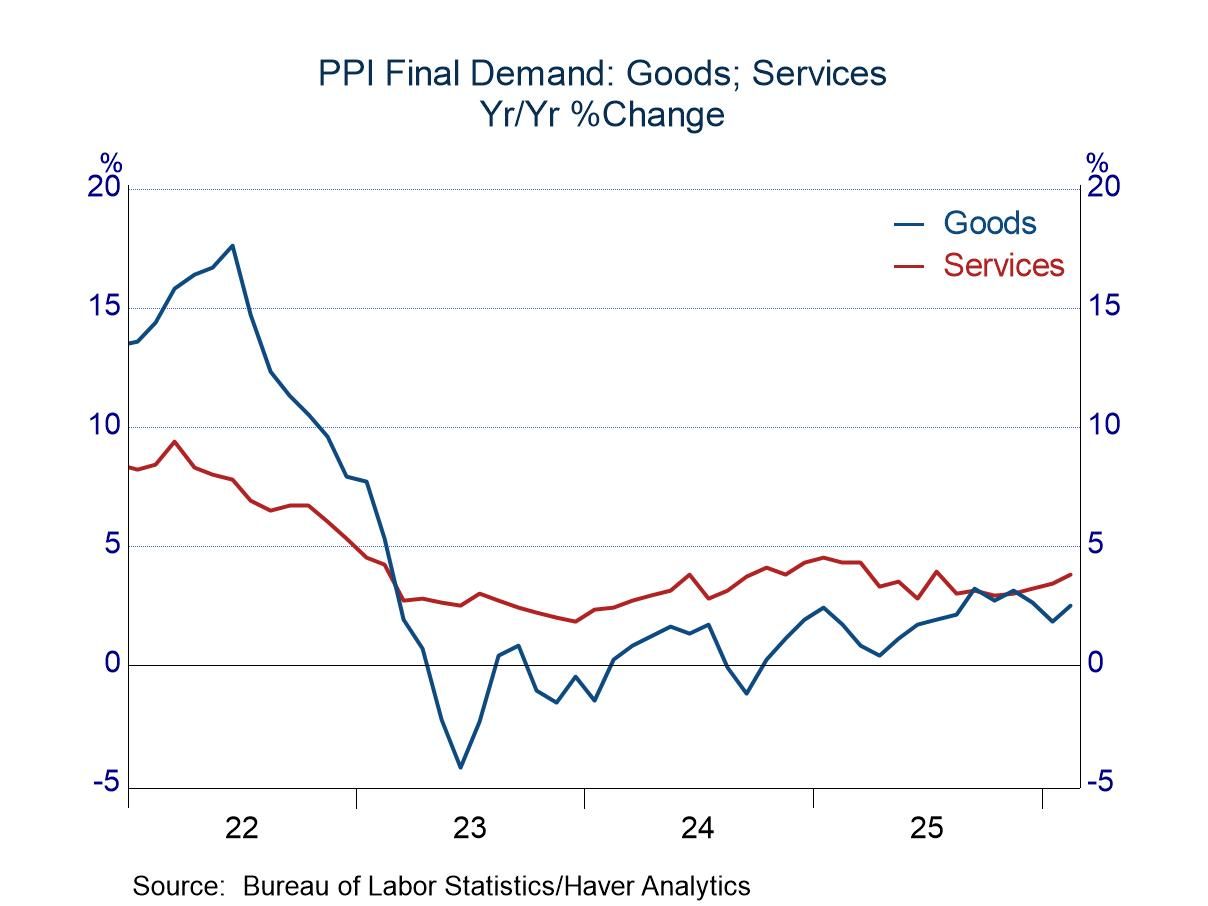
Upward price pressure in recent months has been evident on both the goods and service sides. Prices of goods other than food and energy rose 0.3% in February following an average advance of 0.5% in the prior three months. Service prices rose 0.5% in February, matching the average increase in the November-January period. The year-over-year changes were brisk for both groupings: 4.3% for core goods and 3.8% for services.
The PPI data are published by the Bureau of Labor Statistics and can be found in Haver’s USECON database. Further detail is contained in PPI and PPIR. The expectations figures are available in the AS1REPNA database.

Michael J. Moran
AuthorMore in Author Profile »Before joining Haver Analytics in 2025, Michael J. Moran was the chief economist of Daiwa Capital Markets America Inc. He was responsible for preparing the firm’s economic forecast and interest rate outlook. He traveled frequently to visit the clients of Daiwa Capital Markets and wrote weekly economic commentary. Mr. Moran also was involved in the flux of financial markets, as he spent a portion of each day on Daiwa’s trading floor interpreting economic statistics and Federal Reserve activity for traders and salespeople. Mr. Moran is quoted frequently in the financial press, and he appears regularly on cable news shows. He also has published articles in several journals and periodicals. Before joining Daiwa Capital Markets America, Mr. Moran worked as an economist at the Federal Reserve Board in Washington, D.C. where he analyzed a broad range of issues dealing with the financial sector of the economy and regularly briefed the Board of Governors. He was on the faculty of Pennsylvania State University from 1979 to 1980 and taught on a part-time basis at George Washington University from 1980 to 1987.
Mr. Moran received his Ph.D. in economics from Pennsylvania State University in 1980 and a B.S. in business administration from the University of Bridgeport in 1975. He was a CFA charter holder from 2002 until 2016.
More Economy in Brief


 Global