 Global| Nov 20 2025
Charts of the Week: The Year Ahead
Summary
As 2025 draws to a close, the global economy feels caught between relief and unease. Inflation has eased but not fully retreated, monetary-policy cycles are pulling in different directions, markets are oscillating between AI-driven enthusiasm and valuation nerves, and geopolitical tensions are pressing harder on trade, energy and investment flows. Against this backdrop, the twelve themes that follow set out the forces most likely to shape the macro, market and policy landscape in 2026. They range from the pivotal questions around whether AI will deliver visible productivity gains, how far the AI narrative can continue to support markets, and how policymakers will manage an unusually uncertain interest-rate outlook, to the broader pressures created by fiscal strains, climate stress, shifting trade patterns, geopolitical fragmentation, political transitions, and demographic change. Taken together, they offer a map of the terrain investors and policymakers will need to navigate in the year ahead — a world where cyclical dynamics and structural shifts arguably interact more tightly than at any point in the past decade, and where the biggest surprises are likely to emerge from those intersections.
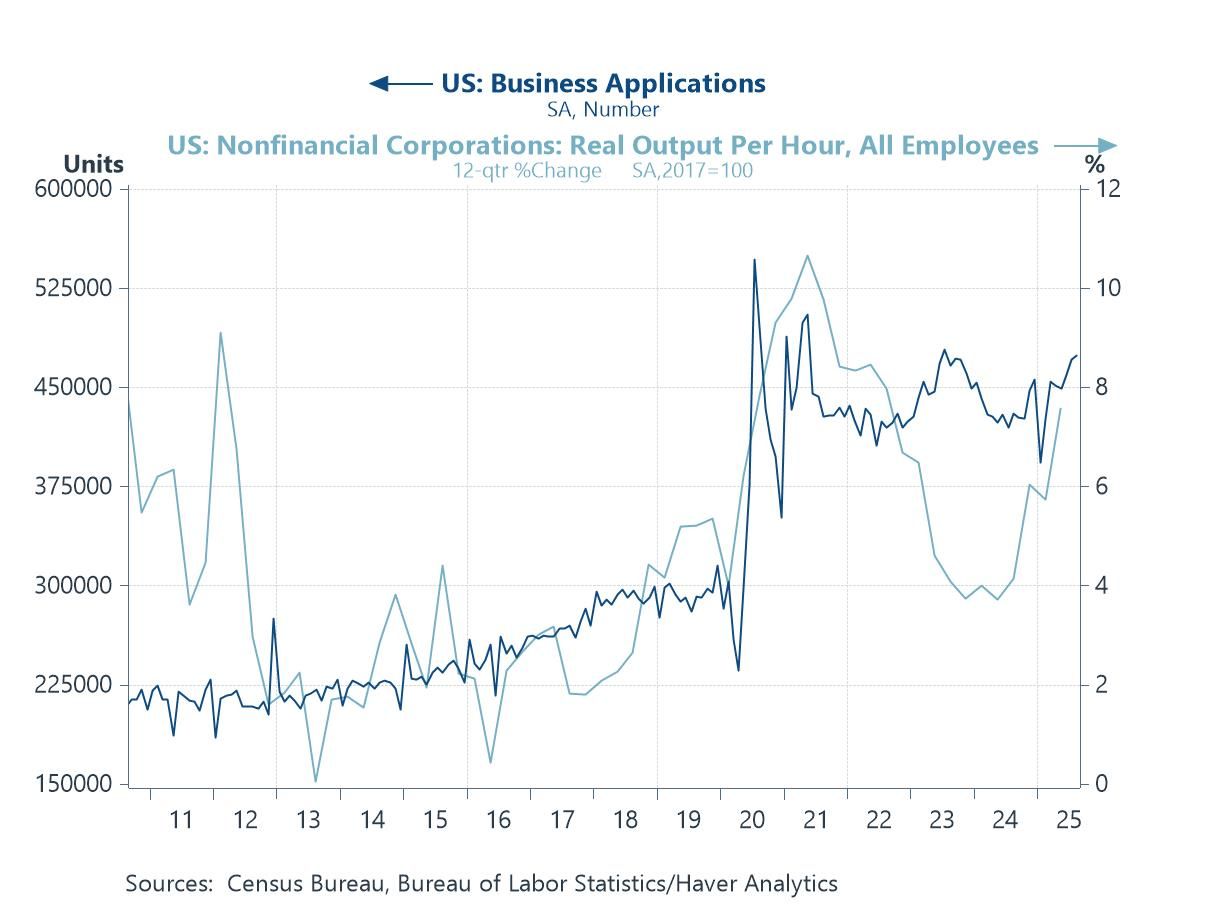
AI’s Promised Land A major question hanging over 2026 is whether the rapid advances in AI will finally translate into visible, economy-wide productivity gains. That debate is already shaping expectations for the year ahead, and recent data offer some tentative encouragement. The surge in US business applications since the pandemic points to renewed entrepreneurial energy, and many US economists — according to our latest Blue Chip surveys of forecasters — are optimistic that AI will lift trend productivity over the coming years. Real output per hour (in the US non-financial corporate sector) has also begun to firm, suggesting that the initial experimentation phase may be giving way to deeper operational integration (chart 1). Still, history urges caution: past technology waves have shown that productivity gains tend to arrive unevenly and with a lag, as firms reconfigure processes, retrain workers and invest in complementary infrastructure. As we discuss further below constraints around power availability, computing capacity and labour supply could slow the pace of diffusion. Even so, the combination of rising business formation, improving productivity indicators and a more confident professional consensus does hint at a more dynamic US supply side. The key issue for 2026 will be how quickly these early gains spread beyond early adopters and begin to shift the macro narrative in a more durable way.
Chart 1: A Hint of Acceleration: US Productivity Growth and New Business Formation
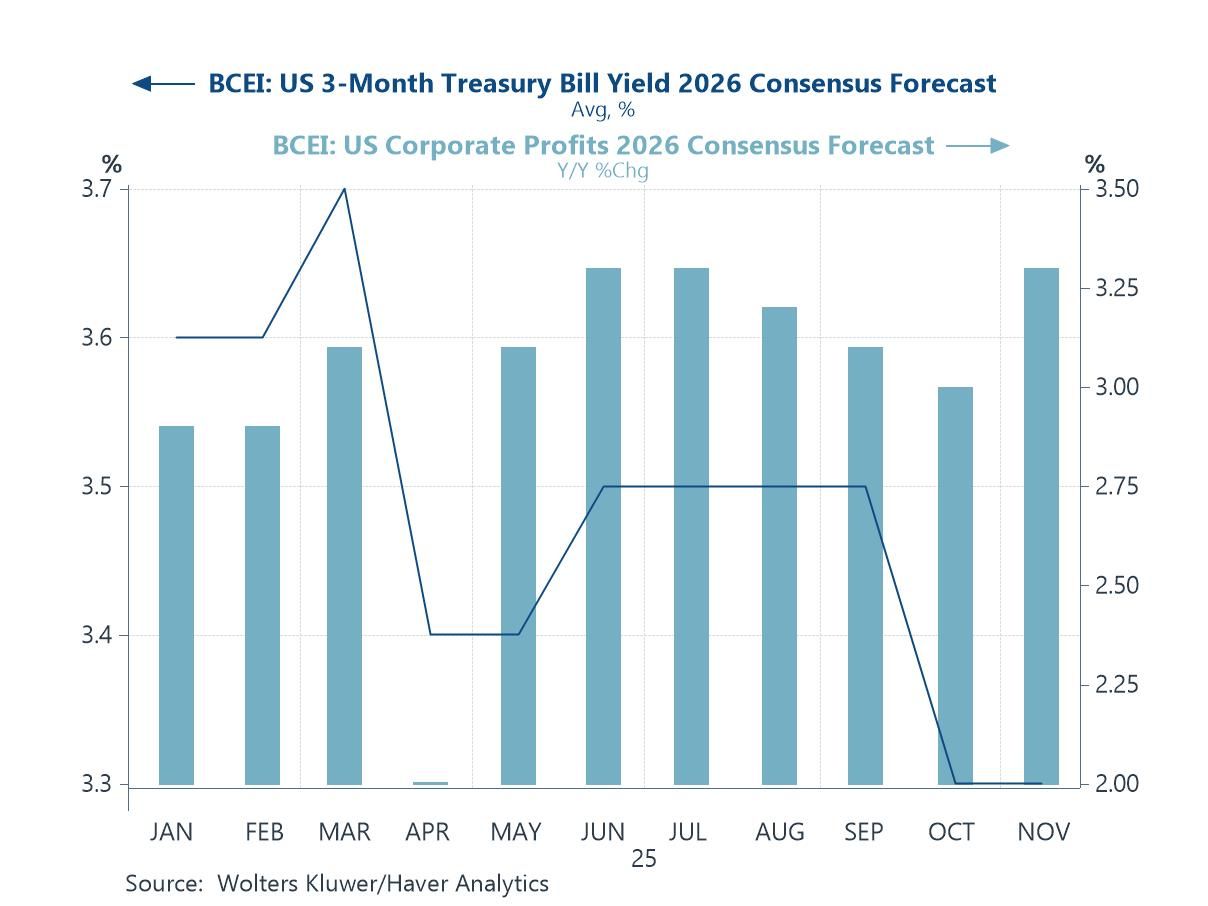
Financial Markets and the AI Narrative Following on from the productivity question, debate over a potential AI-driven equity market bubble will also be a defining theme for 2026, and the shifting expectations shown here help explain why investors are increasingly uneasy. Over the course of 2025, consensus forecasts for US profitability in 2026 have drifted higher, reinforcing the view that AI could deliver robust earnings gains across the corporate sector. At the same time, expectations for short-term interest rates have edged lower, supporting higher valuations through the discount-rate channel (chart 2). This combination—a rising profit narrative paired with falling rate expectations—is a powerful tailwind for equity multiples, and it has helped sustain the extraordinary outperformance of AI-linked firms. But it is also the kind of macro configuration that has historically amplified the risk of over-valuation, especially when the underlying technological transformation is still in its early and uneven adoption phase. The key question for next year is whether these profit expectations prove resilient as the real economy absorbs the costs of AI integration—energy constraints, capex demands, talent shortages and potential regulatory pushback. If earnings forecasts begin to slip or rate expectations turn, even modestly, the valuations built on the AI story may look increasingly stretched. For now, equity markets (until very recently) have been pricing an almost immaculate hand-off between falling rates and rising profits. Whether that balance holds will be central to how the AI narrative evolves in financial markets next year.
Chart 2: The 2025 Evolution of US Profit and Short-Term Interest-Rate Expectations for 2026
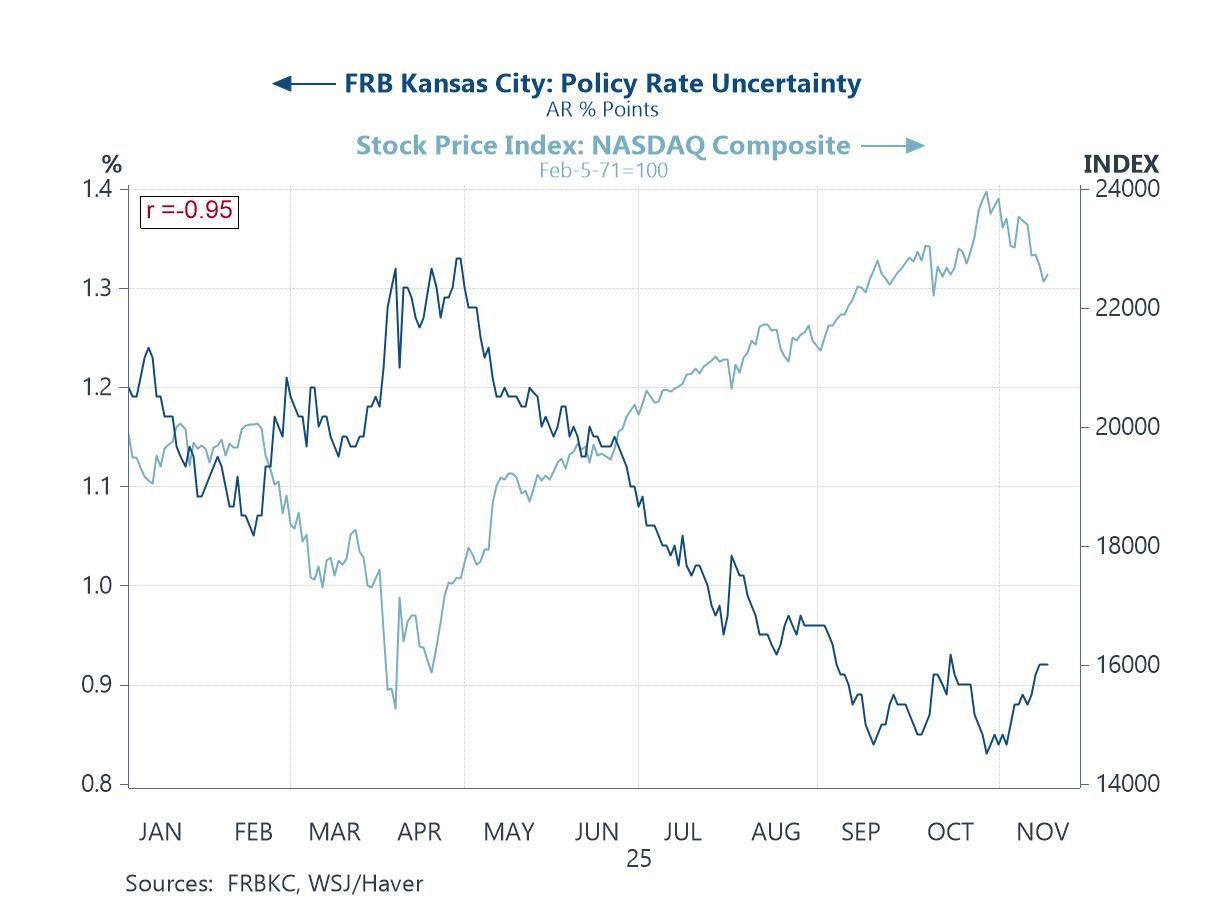
Monetary Policy Uncertainty Building on these valuation tensions, monetary-policy uncertainty is likely to play a larger role in shaping market dynamics in 2026, and while the picture in the US has turned more favourable, the global backdrop is more complicated. The steady decline in the Kansas City Fed’s policy-rate uncertainty index through 2025 has helped support the Nasdaq’s strong performance (chart 3) — a reminder of how sensitive AI-exposed, long-duration equities are to even small shifts in the expected rate path. The Fed’s growing responsiveness to softer labour-market signals provides an important stabiliser: with vacancies cooling, payroll growth slowing and wage pressures easing, the Fed can retain the flexibility to ease gradually and deliberately. But globally, the story is more mixed. Several major central banks — the ECB, BoE and RBA in particular — are nearing the end of their easing cycles, which means the “rate-tailwind” that has supported global risk assets may fade as 2026 progresses. Meanwhile, the Bank of Japan is leaning in the opposite direction as it continues to normalise policy, raising the prospect of tighter financial conditions and potential spillovers into global bond markets. This divergence could widen cross-country yield spreads, complicate capital flows and introduce a new layer of uncertainty for global tech valuations.
Chart 3: Kansas City Fed Policy-Uncertainty Index vs Nasdaq: Signals Heading Into 2026
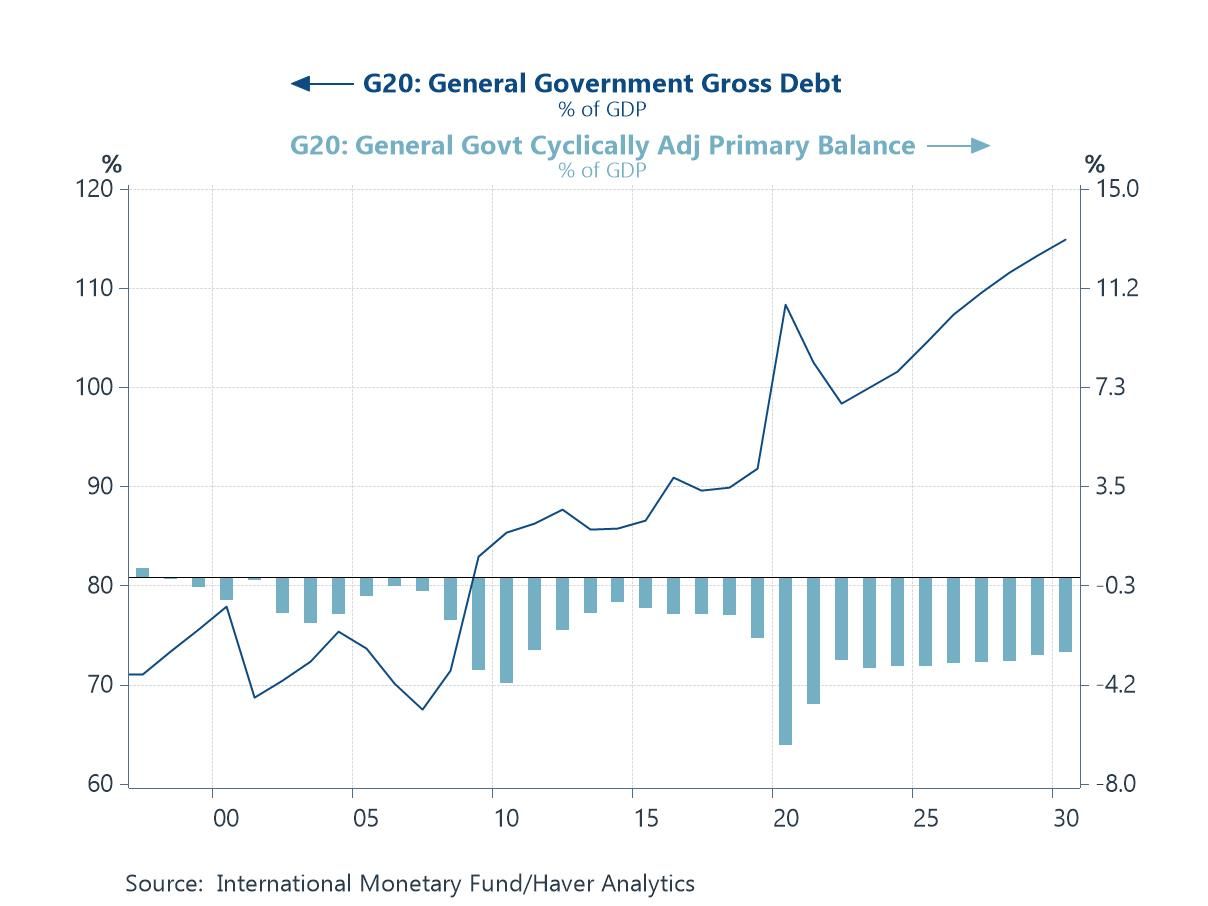
Fiscal Firepower or Fiscal Fatigue? As the policy backdrop shifts, another central issue for 2026 is whether major economies still have the fiscal firepower to support growth—or whether rising public‑debt burdens are finally ushering in an era of fiscal fatigue. Chart 4 below captures the dilemma clearly: G20 debt ratios have risen for over a decade and are set to climb further, while primary balances remain persistently in deficit. Fiscal policy is still doing much of the macroeconomic lifting. Country specifics sharpen the picture. In the US, the outlook hinges on the fate of the expiring tax cuts and whatever fiscal package follows—scenarios that could keep deficits wide regardless of political control. Europe faces rising defence commitments, costly green-transition pledges, and the return of EU fiscal rules, forcing governments into increasingly delicate trade-offs. Japan adds a new wrinkle: Prime Minister Takaichi is expected to take a tougher fiscal line just as the BoJ edges away from ultra-easy policy, a combination that may bring Japan closer to “normal” market scrutiny over debt sustainability. China continues to rely on quasi-fiscal channels and local-government borrowing—supporting growth tactically but intensifying long-term structural strains. All of this feeds directly into the wider macro narrative. Persistent deficits may cushion demand in 2026, but higher debt levels cloud the outlook for monetary policy—especially if central banks fear fiscal-driven inflation or rising term premiums. With the AI boom, the energy transition and geopolitics all demanding public funding, this may be the year markets discover where fiscal space genuinely runs out.
Chart 4: Rising G20 Debt and Persistent Primary Deficits
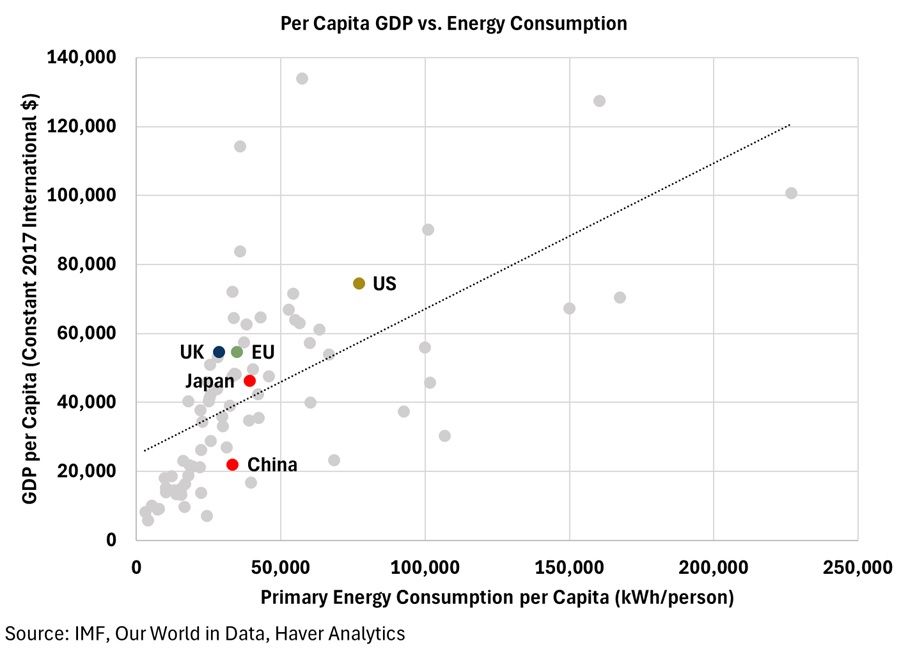
Energy and the AI Power Squeeze Layered on top of these fiscal concerns is a growing tension in global energy systems: whether supply can keep pace with the competing forces now driving demand sharply higher. AI is emerging as a particularly voracious consumer of electricity, with data-centre loads expanding so rapidly that several countries are already revising grid plans, pausing new connections, or ring-fencing capacity for strategic uses. But the AI surge is only one side of the story. Large emerging markets—India, Indonesia, Vietnam, Nigeria and others—are pushing through energy-intensive phases of industrialisation, and chart 5 below reinforces a familiar pattern: as economies climb the income ladder, per-capita energy consumption rises with them. Climate dynamics compound these pressures. More extreme heat is increasing cooling demand year-round, forcing households, firms and grids to draw more power simply to maintain normal activity. The result is a widening global energy trilemma: how to accommodate AI’s electricity appetite, support EM development, and cut emissions—all while managing increasingly fragile geopolitics. From Middle East supply risks to US–China competition over critical minerals and clean-tech supply chains, energy is once again a central axis of global conflict and coordination. And beneath it all lies the basic relationship shown in the chart: higher living standards remain tightly bound to greater energy use. In 2026, the world could feel that constraint more acutely than ever.
Chart 5: Energy Use and Living Standards: The Global Relationship
Climate Change and Green Bottlenecks Climate dynamics will loom even larger over the global outlook in 2026 as the tight links between rising temperatures, industrialisation and energy consumption become harder to ignore. Chart 6 below illustrates this long-run coupling: as global per-capita energy use has trended steadily higher—driven first by the industrialisation of the West, then by China’s rise, and now by the next wave of emerging-market growth—global surface temperatures have climbed in near-lockstep. Much of the world is entering a phase where climate impacts are no longer abstract risks but material economic forces: more extreme heat is lifting baseline energy demand for cooling, reshaping seasonal load patterns, and straining grids already stretched by AI-related electricity use. For developing economies, the challenge is even sharper. Their push to industrialise—an essential path to higher incomes—comes with rising emissions unless clean-energy capacity can scale dramatically faster than it has to date. Meanwhile, geopolitical shocks from the Middle East to the South China Sea threaten to disrupt the fossil-fuel supplies that still anchor the world’s energy system. Put simply, climate change is no longer a peripheral consideration for economic forecasting: it shapes energy availability, investment needs, and physical productivity in ways that will be central to the 2026 narrative.
Chart 6: Per-Capita Energy Consumption vs. Global Surface Temperature Anomalies

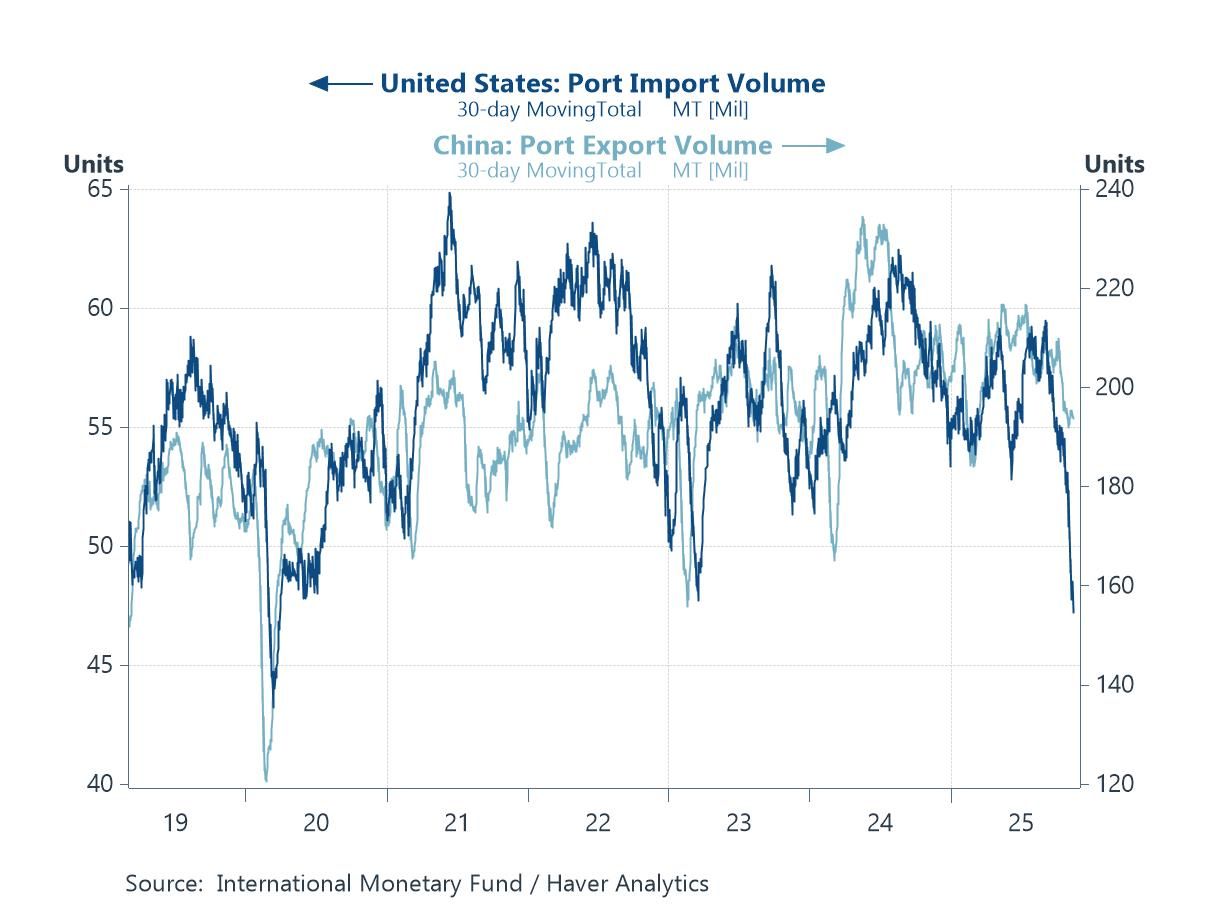
The New Trade Shock: Tariffs, Tangles and Tactical Supply Chains While the global growth and trade backdrop ultimately proved better than investors had feared earlier in the year following President Trump’s initial tariff actions, much remains in flux in the year ahead. The US–China relationship, despite a recent, mildly conciliatory turn, remains fluid. Flashpoints and flare-ups in trade frictions remain possible, particularly in the absence of a comprehensive and conclusive trade agreement, with current concessions still only temporary. Uncertainty also surrounds the remainder of Trump’s previously threatened sectoral tariffs—such as those targeting semiconductors—which have yet to play out. A number of closely watched trade negotiations also hang in the balance, including prospective US bilateral deals with Canada and India. Meanwhile, US demand from its trading partners has already softened. As chart 7 below shows, US import shipments by weight have slid toward pandemic-era lows, while China’s export shipments have also declined.
Chart 7: US and China port trade volume
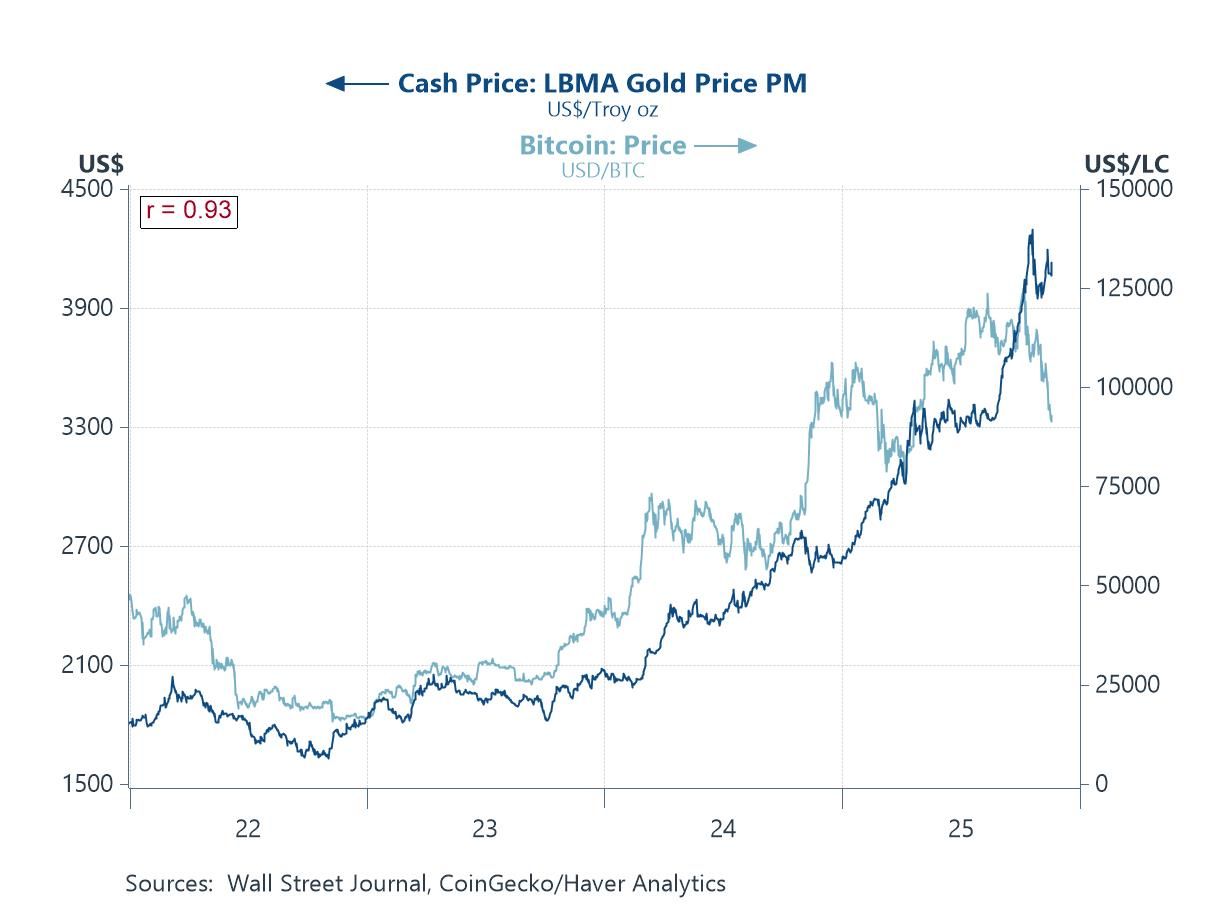
Commodity Whiplash Amid the year’s flurry of events—including dramatic US trade actions, the longest-ever US government shutdown, monetary policy easing by central banks, and pockets of geopolitical tension—prices of gold and cryptocurrencies such as bitcoin have surged to fresh record highs. A wide range of factors has driven these rallies, from safe-haven demand to speculative inflows as momentum built. In gold’s case, institutional diversification needs have also played a role. However, the recent pullback in both gold and bitcoin (chart 8) —particularly the sharper correction in bitcoin—has raised questions about the durability of their longer-term rallies. Looking ahead, slower-moving but persistent central bank demand should continue to provide a floor for gold, while its outlook remains closely tied to global macro conditions. A lower-yield, high-uncertainty environment, coupled with solid jewellery, manufacturing, and speculative demand, would be supportive of further price gains. For bitcoin, whose retreat has accelerated following its earlier meteoric rise—pushing prices below $90,000 for the first time in over six months—volatility is likely to remain elevated. Its price will likely continue to swing with shifts in investor sentiment and expectations of broader adoption, with negative headlines prone to triggering sharp sell-offs and positive developments capable of fuelling renewed rallies.
Chart 8: Gold and bitcoin prices
Geopolitics in Overdrive The year ahead will continue to see many persistent geopolitical flashpoints, alongside emerging ones. Ongoing tensions—such as US–China frictions, the Russia–Ukraine war, and the back-and-forth between Israel and Hamas—will remain closely watched for potential flare-ups. Similarly, disputes between Thailand and Cambodia, despite an earlier US-brokered peace deal, continue to warrant attention, as renewed tensions could still emerge. More recently, China and Japan experienced a rapid escalation in tensions following remarks by Japan’s new Prime Minister Takaichi on Taiwan, prompting sharp responses from Chinese authorities, including advisories for citizens to avoid traveling to Japan. This latest dispute highlights how geopolitical tensions can impact economies through different channels—in this case, tourism. For Japan, as chart 9 below shows, mainland Chinese tourists have historically been the largest single source of tourism expenditure, meaning a near-complete halt would have a tangible economic impact.
Chart 9: Japan tourist inbound expenditure

The Election Supercycle The year ahead will also feature another slate of elections, with the US midterms likely the key event to watch. Traditionally, midterm elections result in swings against the incumbent President, making the upcoming one a bellwether of President Trump’s standing among voters, especially following recent electoral upsets this year. The period surrounding the midterm elections could bring a temporary phase of uncertainty, as past experience has shown (chart 10). A significant swing toward the Democrats could make Republican-led legislation difficult to pass and potentially signal a shift toward more bipartisan or nonpartisan policies. Investors will closely monitor all 435 House of Representatives seats and the 35 of 100 Senate seats up for election, with Republicans currently holding majorities in both chambers. Beyond the US, general elections in Sweden, New Zealand, and the anticipated election in Thailand will also draw attention due to their potential economy-specific implications.
Chart 10: US elections and policy uncertainty

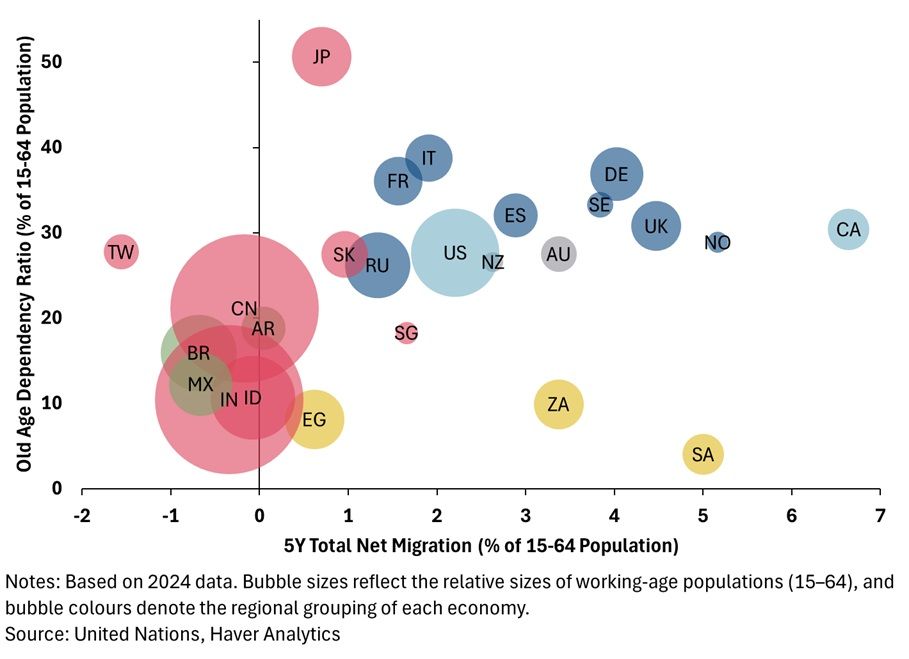
Migration, Workforces and the New Demographic Reality Immigration and labour market issues are likely to remain prominent in the year ahead, reflecting broader concerns about long-term demographic trends in the world economy. Many developed countries continue to face rapidly aging populations as fertility rates remain low or decline further. At the same time, political resistance to using immigration to offset labour shortfalls has intensified in recent years. This trend is evident in the popularity of leaders perceived as hawkish on immigration, including US President Trump, the rise of far-right voices in Europe, and more recently, Japan’s new Prime Minister Takaichi. Despite these debates, net migration in many developed economies has not been sufficient to meaningfully reduce old-age dependency ratios relative to developing countries, as shown in chart 11 below. Japan is a striking example. Even before the rise of its current Prime Minister, the country faced a combination of a high old-age dependency ratio and very low five-year net migration, both expressed as a percentage of the working-age population. This highlighted a deep-seated demographic challenge, one that could worsen under tighter immigration policies if no other viable alternatives emerge.
Chart 11: Old age dependency ratio vs. net migration
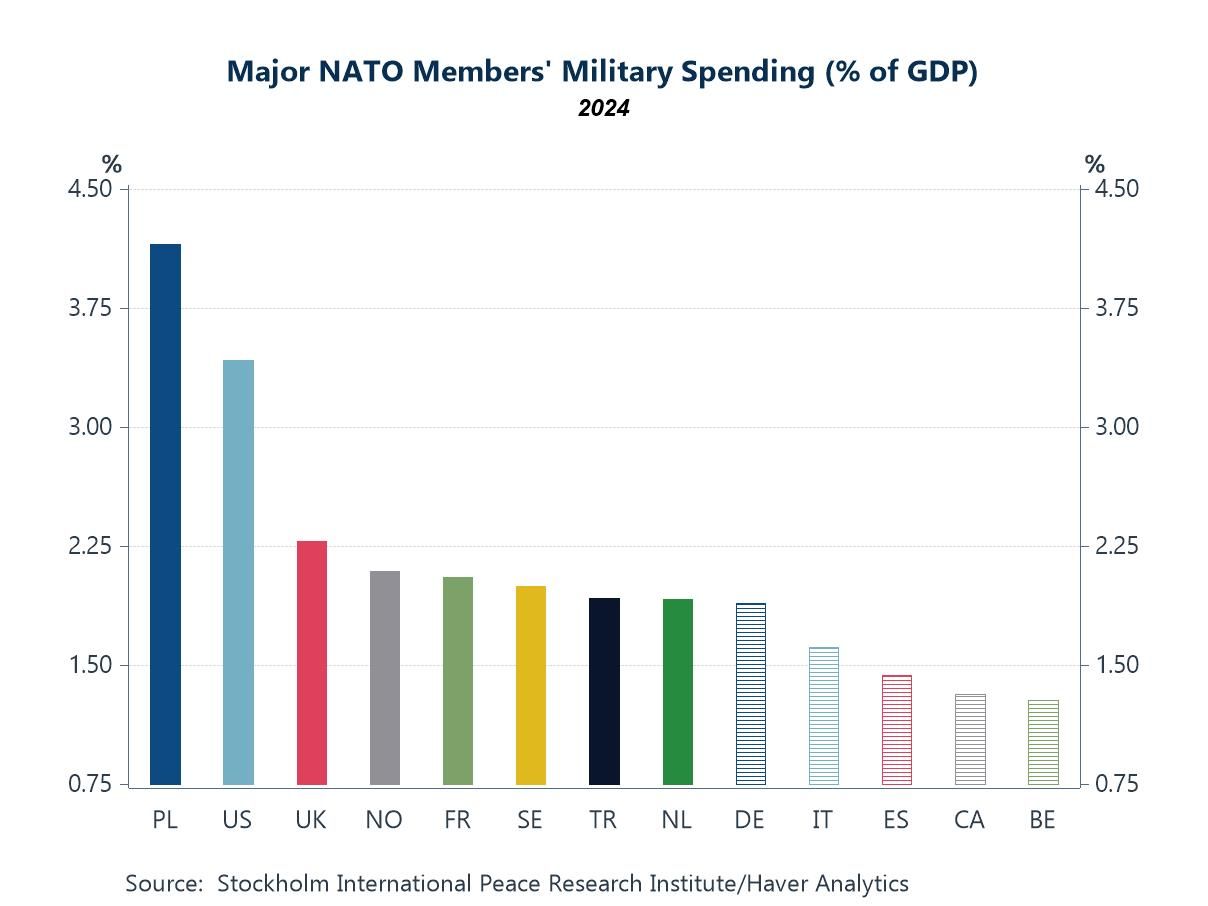
Credit on a Tightrope The year will bring notable developments in debt and credit conditions, with implications for financial stability. Across major economies, pressure for higher public spending — and thus increased borrowing — is rising. Under US pressure, several NATO members have pledged to raise defence outlays; as of 2024, Poland leads in military spending as a share of GDP, followed by the US and UK (chart 12). Europe’s rapidly ageing populations make higher healthcare spending inevitable. With more high-income taxpayers retiring and a growing number of pensioners, countries face rising expenditure alongside pressure on income-tax revenues. Outside Europe, China’s debt-fuelled growth continues to draw scrutiny amid shrinking opportunities for efficient investment, while its property market remains a focus despite slower deterioration. In emerging Asia, domestic currency markets — including India and parts of Southeast Asia — are poised for potential volatility from foreign-investor flows, influenced by monetary policy, economic prospects, and geopolitical developments.
Chart 12: Major NATO members’ military spending

Andrew Cates
AuthorMore in Author Profile »Andy Cates joined Haver Analytics as a Senior Economist in 2020. Andy has more than 25 years of experience forecasting the global economic outlook and in assessing the implications for policy settings and financial markets. He has held various senior positions in London in a number of Investment Banks including as Head of Developed Markets Economics at Nomura and as Chief Eurozone Economist at RBS. These followed a spell of 21 years as Senior International Economist at UBS, 5 of which were spent in Singapore. Prior to his time in financial services Andy was a UK economist at HM Treasury in London holding positions in the domestic forecasting and macroeconomic modelling units. He has a BA in Economics from the University of York and an MSc in Economics and Econometrics from the University of Southampton.

Tian Yong Woon
AuthorMore in Author Profile »Tian Yong joined Haver Analytics as an Economist in 2023. Previously, Tian Yong worked as an Economist with Deutsche Bank, covering Emerging Asian economies while also writing on thematic issues within the broader Asia region. Prior to his work with Deutsche Bank, he worked as an Economic Analyst with the International Monetary Fund, where he contributed to Article IV consultations with Singapore and Malaysia, and to the regular surveillance of financial stability issues in the Asia Pacific region.
Tian Yong holds a Master of Science in Quantitative Finance from the Singapore Management University, a Master of Science in Analytics from the Georgia Institute of Technology, a Bachelor of Science in Mathematics from the Singapore University of Social Sciences, and a Bachelor of Science in Banking and Finance from the University of London.
More Economy in Brief


