 Global| Mar 04 2026
Charts of the Week: Shockwaves from the Gulf
by:Andrew Cates
|in:Economy in Brief
Summary
Geopolitical tensions in the Middle East have escalated sharply following joint air strikes by Israel and the United States on strategic targets in Iran. While the ultimate trajectory of the conflict remains highly uncertain, the episode highlights the potential for geopolitical shocks to ripple through multiple channels of the global economy—from energy markets and shipping routes to supply chains, inflation dynamics and monetary policy. In this week’s Charts of the Week, we present six charts that illustrate some of the key issues, implications and points to watch, including movements in geopolitical risk (chart 1), shipping activity through the Strait of Hormuz (chart 2), energy prices (chart 3), global supply chain pressures (chart 4), inflation surprises (chart 5) and the evolving structure of global electricity generation (chart 6). Together they provide a framework for thinking about how events in the region could shape the outlook for the world economy in the months ahead.
Geopolitical risk The escalation in Middle East tensions has already been reflected in a sharp rise in the Caldara–Iacoviello Geopolitical Risk Index, shown in the first chart below. This index—based on the frequency of geopolitical risk references in major international newspapers—has jumped to levels typically associated with periods of acute international tension. For the global economy, the immediate concern is less the direct economic damage and more the uncertainty generated by the conflict. The Middle East remains central to the global energy system, and concerns over potential disruption to oil infrastructure or shipping routes—particularly through the Strait of Hormuz—have already contributed to a sharp rise in energy prices, with knock-on effects for financial markets and the broader outlook for global growth.
Chart 1: Geopolitical risk has surged in recent days

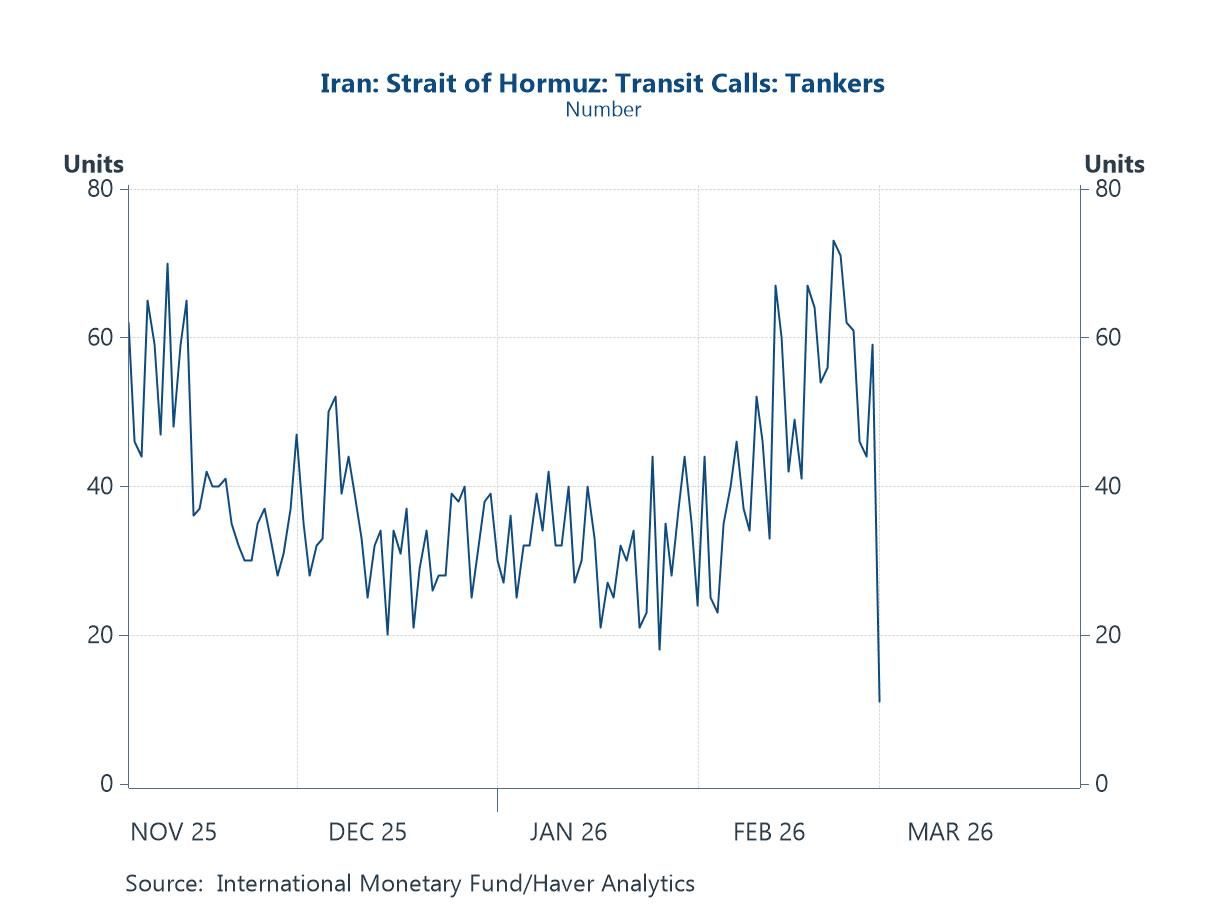
The Strait of Hormuz The strategic importance of the Strait of Hormuz is highlighted in the next chart below, which shows tanker transit calls through the strait. After rising through February, tanker movements have dropped sharply in the wake of the recent escalation in regional tensions. This narrow maritime corridor is one of the world’s most important energy chokepoints, with roughly a fifth of global oil supply and a large share of LNG exports passing through it each day. But its importance extends beyond hydrocarbons: the Gulf is also a major exporter of petrochemicals and fertilizers such as ammonia and urea, key inputs for global agriculture. Any sustained disruption to traffic through Hormuz would therefore have implications not only for energy markets but also for broader global supply chains.
Chart 2: Tanker transit calls through the Strait of Hormuz have collapsed
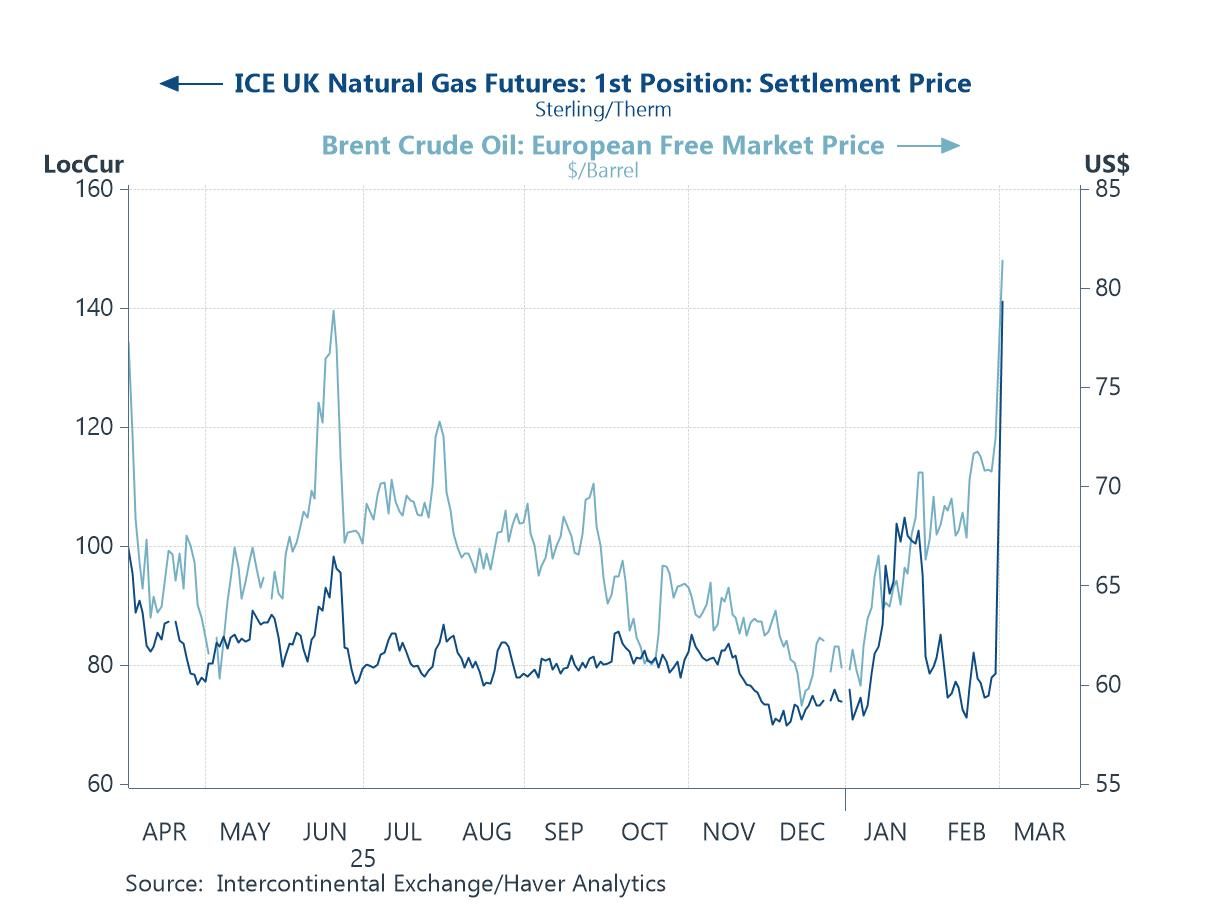
Oil and Natural Gas As noted, the sensitivity of energy markets to developments in the Gulf has been evident in the behaviour of both oil and gas prices. The next chart below shows a sharp move higher in Brent crude alongside a pronounced spike in natural gas futures in recent days. While oil understandably attracts most of the attention given the volume that transits through the Strait of Hormuz, natural gas is equally important from a macroeconomic perspective. The Gulf region is a major supplier of LNG to Europe and Asia, and disruptions to shipping routes or regional infrastructure can quickly tighten global gas markets. For Europe in particular—still structurally more exposed to imported LNG following the loss of Russian pipeline supply—higher gas prices feed directly into electricity costs, industrial input prices and household energy bills. In short, the latest escalation is not simply an oil story; it is an energy story more broadly, with implications for inflation, real incomes and growth across the global economy.
Chart 3: Natural gas and oil prices have surged
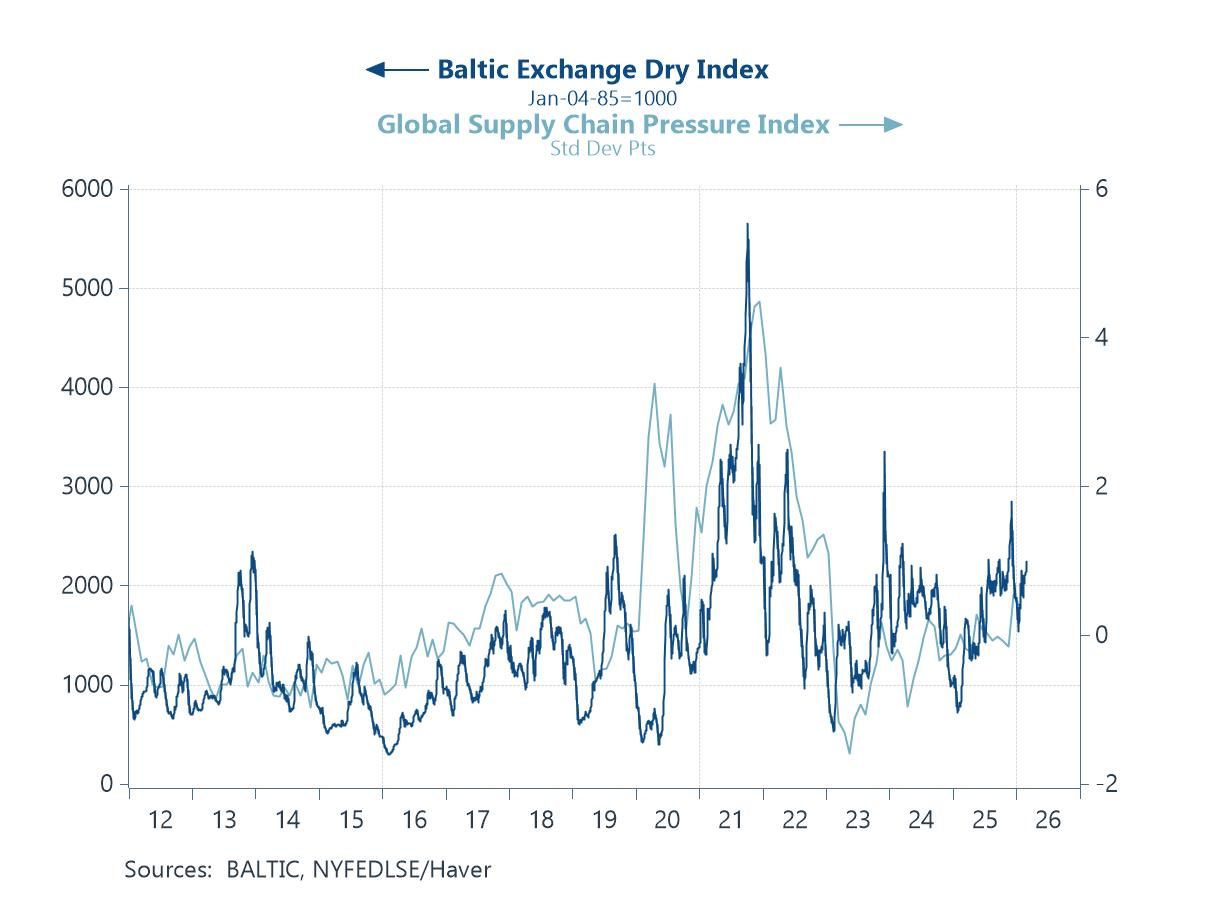
Global shipping costs and supply chain pressures Beyond energy markets, and as also noted above, developments in the Middle East also have the potential to reverberate through global trade and supply chains. The next chart below illustrates this link by comparing the Baltic Exchange Panamax Index—a key benchmark for dry bulk shipping costs—with the New York Fed’s Global Supply Chain Pressure Index. The Panamax index tracks freight rates for vessels typically used to transport bulk commodities such as grains, coal and fertilizers, cargoes that frequently move through or originate from the Gulf region. As such, it provides a useful barometer of shipping conditions that are particularly relevant for the Middle East. Historically, spikes in shipping costs have tended to coincide with periods of heightened supply chain stress, as seen most clearly during the pandemic. Should tensions in the region more forcefully disrupt maritime traffic or insurance conditions for vessels operating near the Strait of Hormuz, freight rates could rise again, potentially amplifying broader supply chain pressures and adding another layer of uncertainty to the global economic outlook.
Chart 4: Shipping costs are on the rise with potential implications for supply chain pressures
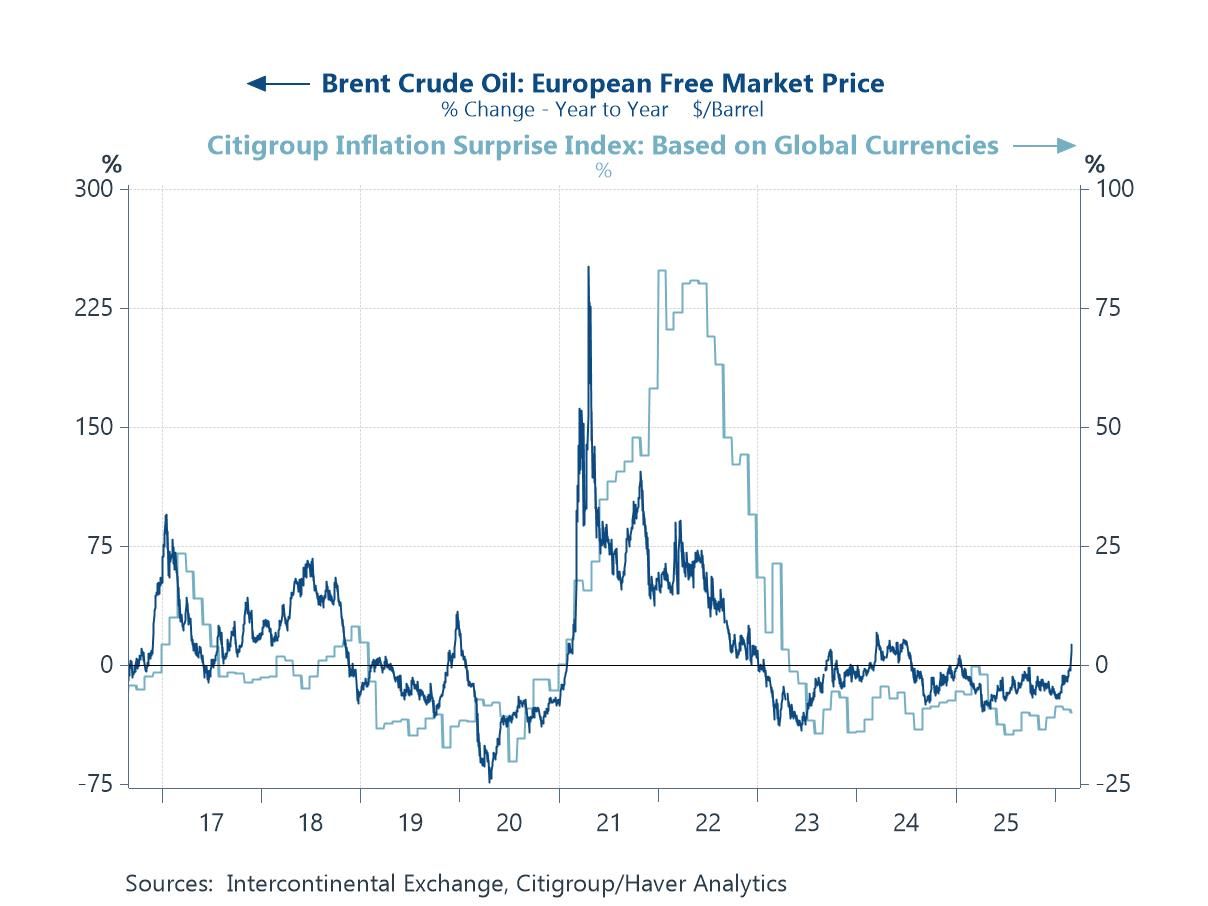
Energy prices and inflation Developments in energy markets also matter because of their close connection with inflation dynamics and monetary policy. The fifth chart below compares year-on-year changes in Brent crude oil prices with the Citigroup Global Inflation Surprise Index, which measures whether inflation outcomes are coming in above or below economists’ expectations. Historically, periods of sharply rising oil prices have often coincided with upside inflation surprises, most notably during the pandemic recovery when energy prices surged and global inflation pressures intensified. This relationship highlights why events in the Middle East are being watched so closely by policymakers. A sustained rise in energy prices would risk complicating the disinflation process that many central banks have been trying to engineer. In turn, this could delay or limit the scope for interest rate cuts and tighten financial conditions more broadly, adding another potential headwind to the global economic outlook.
Chart 5: Firming oil prices typically generates positive inflation surprises (and vice versa)
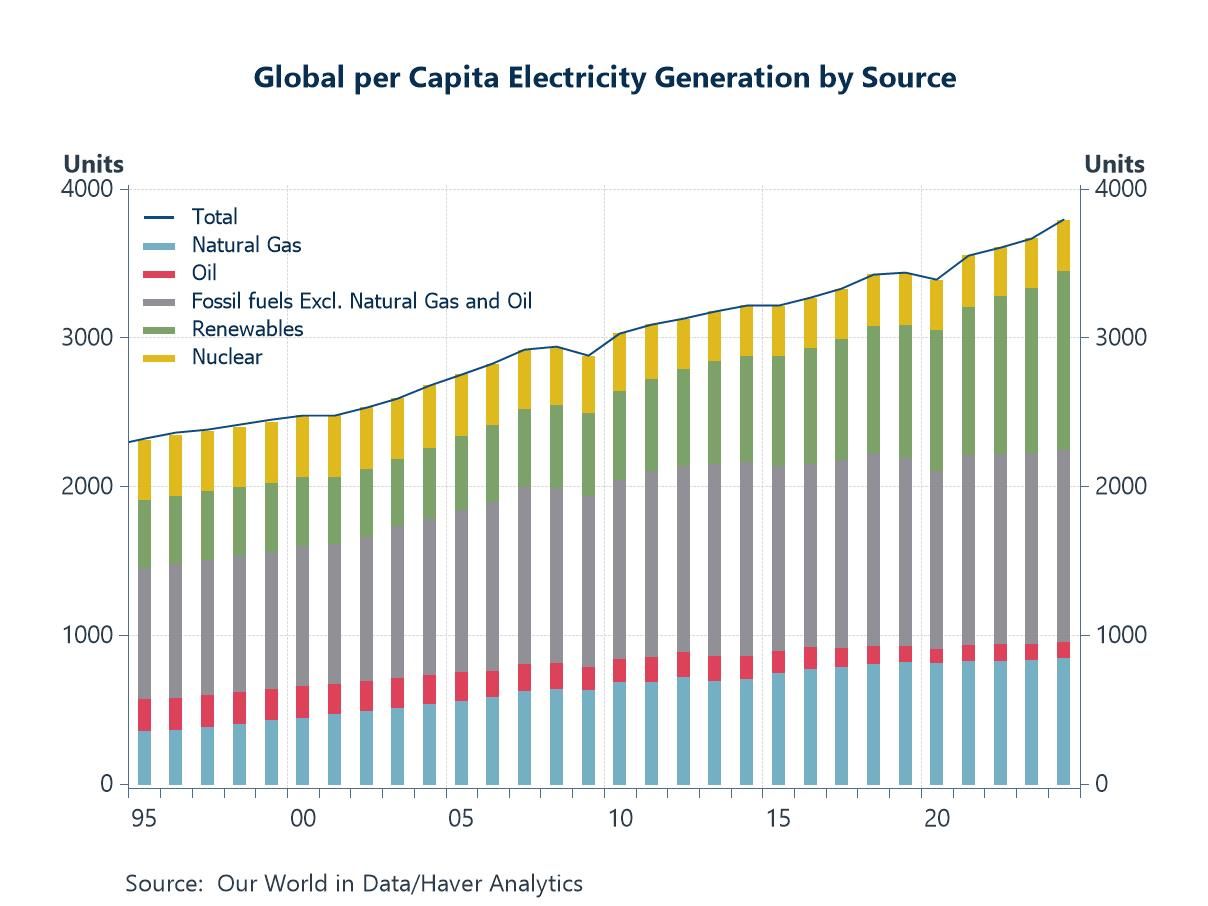
Natural gas and electricity generation The importance of natural gas to the global economy is further illustrated in the final chart, which shows global per capita electricity generation by source. While renewable energy has expanded rapidly in recent years, fossil fuels continue to play a dominant role in meeting rising electricity demand. In particular, natural gas has become an increasingly important component of the global power mix, reflecting its flexibility, relatively lower carbon intensity compared with coal and oil, and its ability to provide reliable baseload and balancing power. Oil, by contrast, now plays only a very limited role in electricity generation in most economies. This backdrop is especially relevant given the rapid expansion of energy demand associated with artificial intelligence and digital infrastructure. Data centres, cloud computing networks and the broader digital economy require vast and reliable supplies of electricity. While renewables are likely to account for a growing share of new capacity, natural gas is expected to remain a critical bridging fuel in ensuring system stability and meeting peak demand. As a result, disruptions to global energy markets—particularly those affecting natural gas and LNG flows from the Middle East—could have implications that extend well beyond traditional energy markets, potentially affecting the pace at which new digital and AI-related infrastructure can be deployed.
Chart 6: Natural gas plays a big role in global electricity generation

Andrew Cates
AuthorMore in Author Profile »Andy Cates joined Haver Analytics as a Senior Economist in 2020. Andy has more than 25 years of experience forecasting the global economic outlook and in assessing the implications for policy settings and financial markets. He has held various senior positions in London in a number of Investment Banks including as Head of Developed Markets Economics at Nomura and as Chief Eurozone Economist at RBS. These followed a spell of 21 years as Senior International Economist at UBS, 5 of which were spent in Singapore. Prior to his time in financial services Andy was a UK economist at HM Treasury in London holding positions in the domestic forecasting and macroeconomic modelling units. He has a BA in Economics from the University of York and an MSc in Economics and Econometrics from the University of Southampton.
More Economy in Brief


