 Global| Jun 11 2026
Charts of the Week: Inflation at the Crossroads
by:Andrew Cates
|in:Economy in Brief
Summary
Global financial markets have been unsettled in recent days. Last week’s stronger-than-expected US employment report wrong-footed investors positioned for a more accommodative Federal Reserve, triggering a sharp reassessment of rate expectations and a notable sell-off in technology stocks — a sector that had been among the primary beneficiaries of the prevailing low-rate narrative. Persistent instability in the Middle East, in the meantime, has continued to keep energy markets on edge, with Brent crude remaining elevated and supply disruption risks showing little sign of abating. Against this backdrop, this week's charts draw on the latest Blue Chip Economic Indicators survey to assess where the global growth and inflation outlook now stands. The headline finding is sobering: GDP growth forecasts have been revised lower across most major economies over the past three months, with the energy shock doing real damage to the outlook in Europe— even as Taiwan's AI-driven semiconductor boom delivers the largest upward forecast revision of any economy in the survey (charts 1 and 2). Inflation expectations tell an equally uncomfortable story, with consensus forecasts for CPI in 2027 now sitting above most central banks' 2% target — a sign that the current shock may be leaving a more persistent scar than policymakers would like. Beneath the headline noise, however, recent US unit labour cost data offer a modestly reassuring signal (chart 3), even as renewed supply chain stress threatens the PPI pipeline (chart 4). We also revisit a structural energy argument made in previous editions of our Charts of the Week document (chart 5), before closing with China's trade data, where a normalisation in export flows to the United States has been quetly unfolding (chart 6).
Growth Forecasts Drift Lower — But AI Keeps the Story Complicated The three-month change in consensus GDP growth forecasts for 2026, drawn from the latest Blue Chip survey, tells a story of broadly deteriorating expectations with one conspicuous exception. The Middle East conflict and the associated surge in energy prices have left their mark across most major economies. The euro area, the UK and the United States have all seen meaningful downward revisions to their 2026 growth outlooks over the past three months, as higher energy costs squeeze household real incomes and dampen business investment intentions. Energy-importing economies in Europe are particularly exposed, and the Blue Chip panel’s international section confirms that growth expectations across much of the continent remain subdued, highlighting persistent regional differences in economic performance. Japan, Australia, India and several emerging markets have seen modest negative revisions for similar reasons. The lone outlier is Taiwan, whose bar extends well above the rest — a direct reflection of the extraordinary momentum in the semiconductor and AI supply chain. Taiwan’s 2026 growth forecast has been revised up by around 3.2 percentage points over the past three months, a revision of a magnitude rarely seen in this survey for any economy.
Chart 1: Blue Chip Consensus GDP Growth Forecast for 2026, 3-Month Change (%)

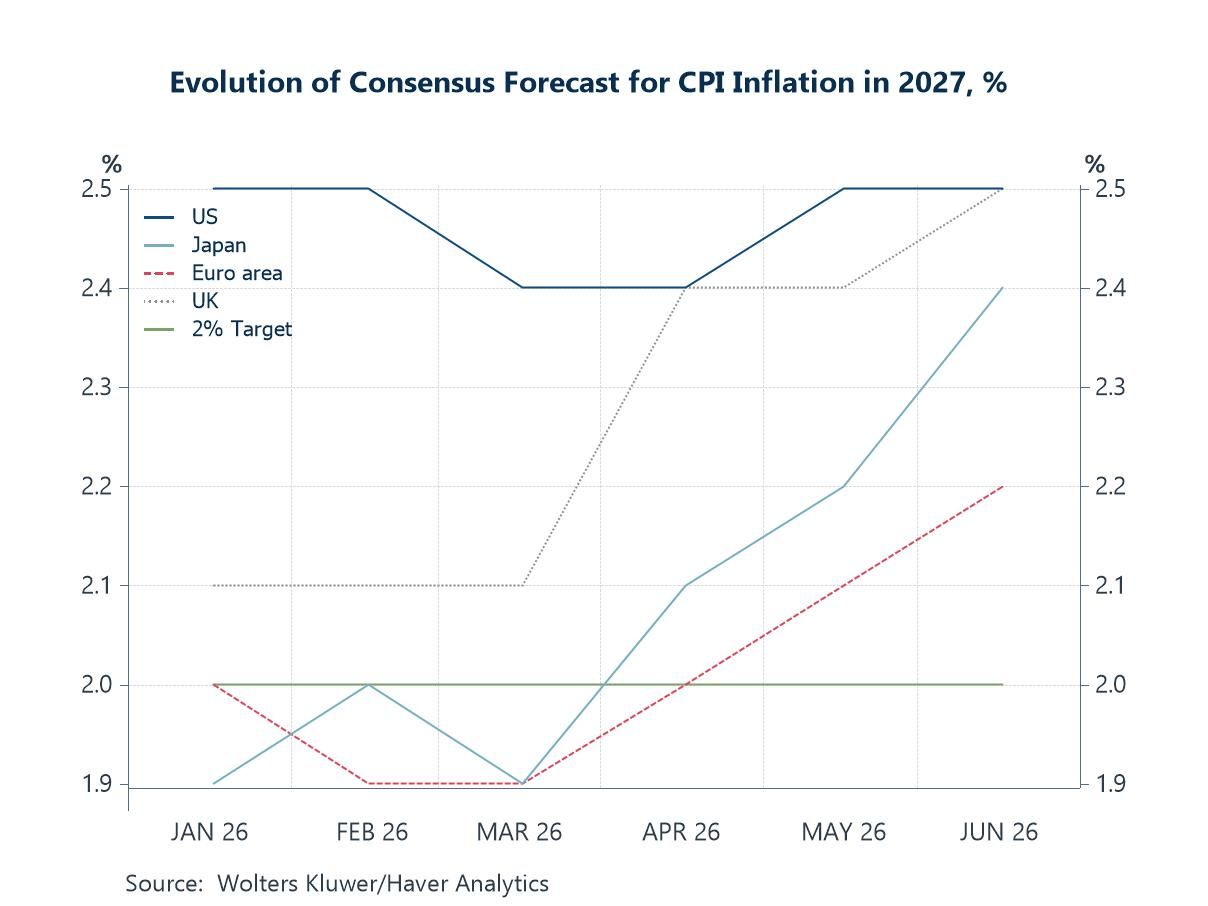
The More Worrying Signal: 2027 Inflation Forecasts Are Drifting Up Too If the GDP revision chart tells a story about the near-term growth impact of the energy shock, this second Blue Chip chart carries a more troubling message for central banks. It shows how consensus forecasts for CPI inflation in 2027 — not 2026, but the year after — have evolved since January. The pattern is striking. Across all four major economies, 2027 inflation expectations have been revised upward since March and now sit at or above the 2% threshold that most central banks treat as their definition of price stability. The US forecast has moved back up to 2.5%; the UK has surged from just above 2% to 2.5%; Japan and the euro area have also drifted higher. Near-term inflation revisions driven by an oil price shock are one thing — central banks can typically look through transitory supply-side disturbances if domestic dynamics remain anchored. But upward revisions to the 2027 outlook are harder to dismiss. They suggest that forecasters are no longer confident the current energy shock will be fully absorbed without leaving a persistent mark on the inflation trajectory — and explain why not a single Blue Chip panellist now expects central banks to simply look through energy-driven inflation.
Chart 2: Evolution of Consensus CPI Inflation Forecast for 2027 (%)
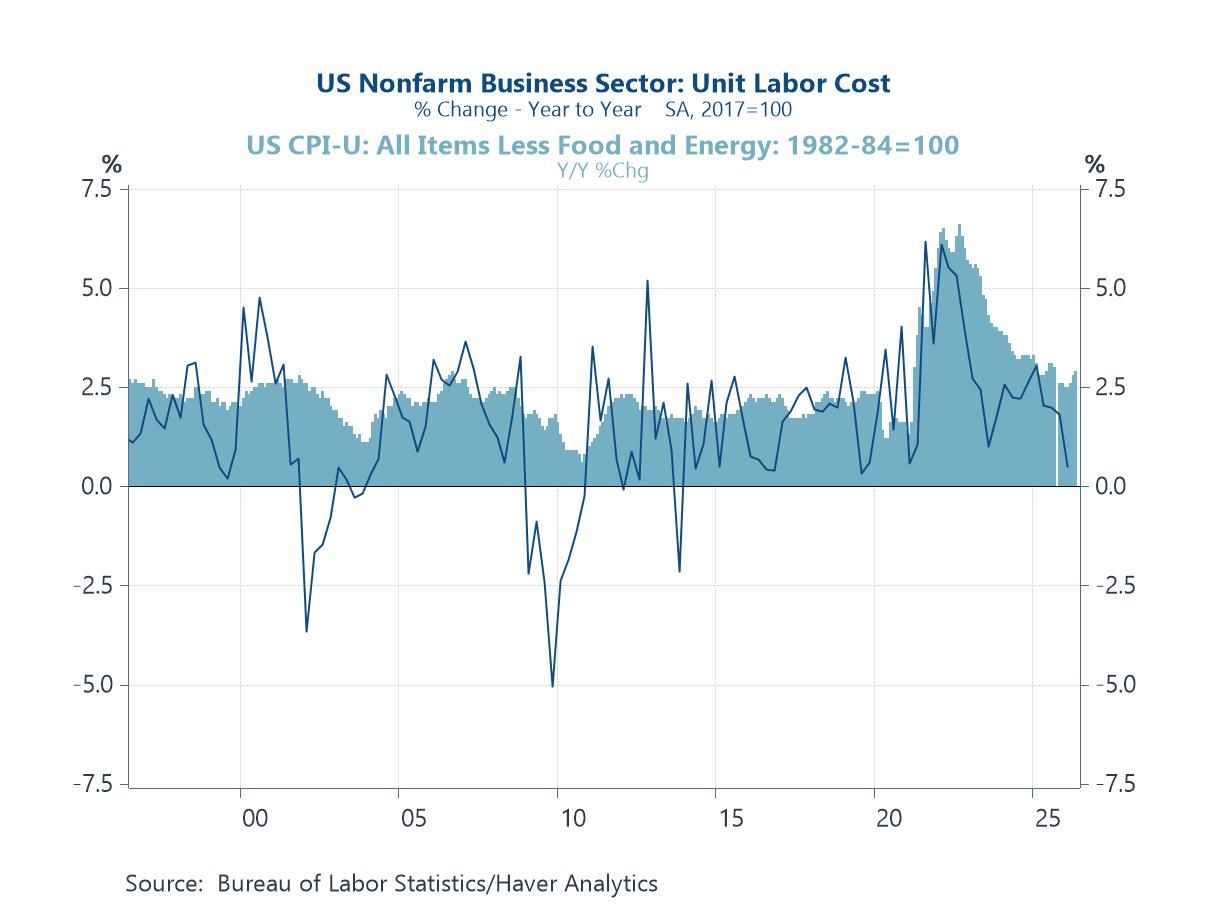
The Fed’s Dilemma: A Benign Labour Cost Story Beneath Hot Headlines This week's US inflation data showed headline CPI jumping sharply in May, driven by higher energy costs. But arguably the more telling number was core inflation, which edged only slightly higher in year-on-year terms — a signal that the price shock remains, for now, predominantly supply-side in character rather than one rooted in domestic demand or wage dynamics. That distinction matters, and it is reinforced by the unit labour cost data, which — though backward-looking, with the latest figures pertaining to Q1 2026 — tell a reassuring story. Labour costs are typically the most persistent component of domestic inflation — energy prices can spike and retreat, but once wage growth becomes embedded, it tends to stay. The fact that unit labour cost growth remained subdued through the first quarter, even as headline CPI was climbing, suggests that domestic wage-price dynamics had not yet taken hold. Whether that remains true as the energy shock feeds through is the key question.
Chart 3: US Unit Labour Cost Inflation – The Reassuring Signal
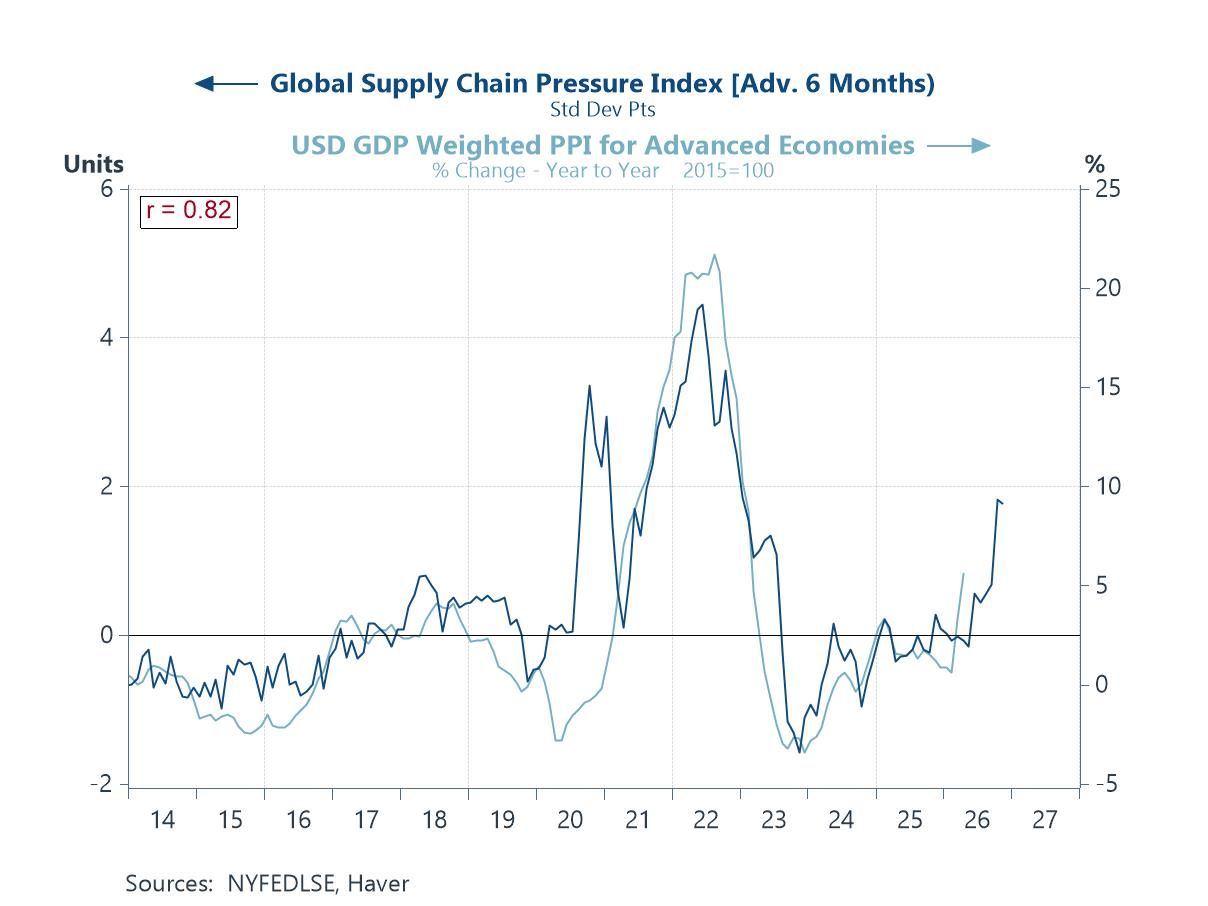
Supply Chain Stress Returns — and Threatens the PPI Pipeline The benign unit labour cost picture is partially offset, however, by a less comfortable development in global supply chains. The New York Fed’s Global Supply Chain Pressure Index has risen sharply in recent months, reversing much of the normalisation achieved since the post-pandemic peak in 2021. The driver is familiar: Middle East instability has disrupted shipping routes, extended delivery times and raised logistics costs across manufacturing supply chains globally. Supply chain pressures feed into producer price inflation with a lag of roughly three to six months, and the PPI pipeline is already showing the effects — US PPI rose 6.0% year-on-year in April, and manufacturing PMI surveys show input cost pressures building across multiple major economies.
Chart 4: Global Supply Chain Pressure Index and PPI Inflation
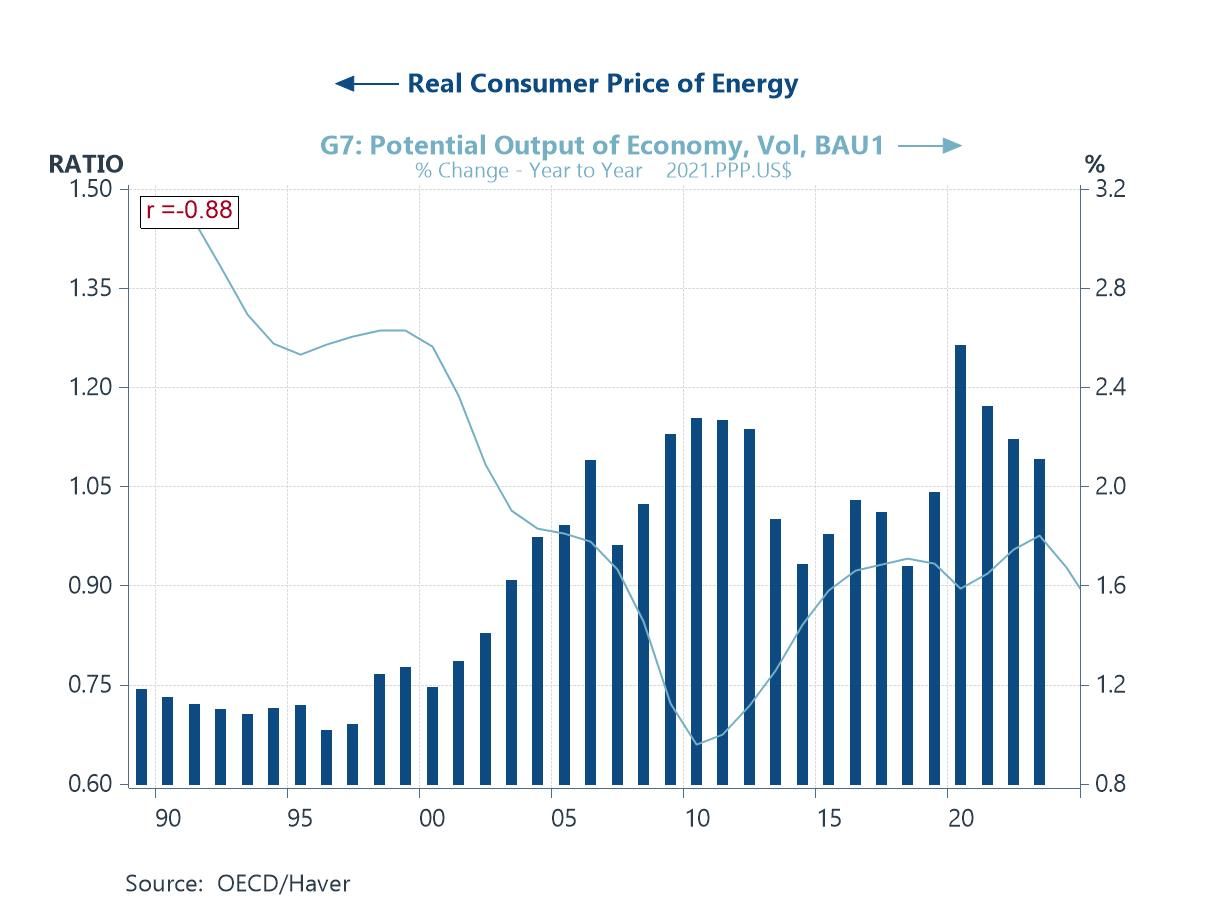
Energy: The Master Variable As we have noted in previous editions of this publication, real energy prices have risen persistently since the early 2000s — a development that may explain more of the trend slowdown in global growth and productivity than is widely appreciated. The chart illustrates that elevated real energy costs are not a new phenomenon: they predate the current Middle East crisis by two decades and were well entrenched long before the US–Iran escalation began in March. What the conflict has done is bring a slow-moving structural story back into sharp focus. For central banks, the implication is an uncomfortable one. Managing inflation whose roots lie in long-run energy supply constraints is a fundamentally different challenge from managing a demand-driven price cycle — and one that conventional monetary policy tools are poorly equipped to address alone. That is not an argument for policy inaction, but it is a reminder that durable price stability is likely to require, among other things, a sustained expansion in the supply of affordable and reliable energy.
Chart 5: Real Energy Prices – A Structural Constraint
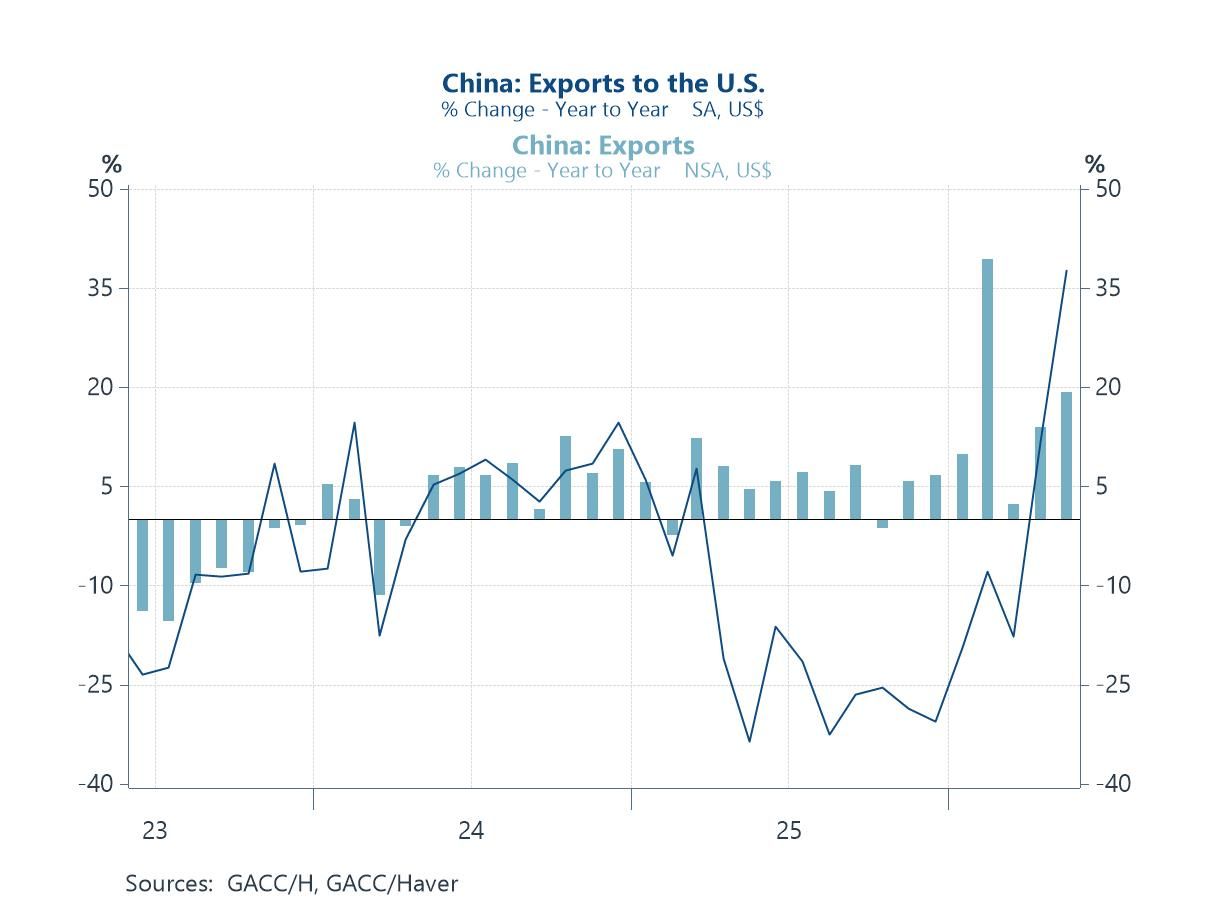
China’s Exports to the US: A Quiet Normalisation Our final chart offers a more encouraging note. This week’s China trade data showed a meaningful improvement in Chinese export growth to the United States, consistent with a partial normalisation of bilateral trade flows that has been evident since the spring tariff truce. Chinese exports to the US had contracted sharply in 2025 as tariff escalation disrupted supply chains. The recovery now underway matters for two reasons. First, it provides a partial deflationary offset: a resumption of Chinese goods exports tends to exert downward pressure on global goods prices, which matters when services and energy inflation are already elevated. Second, it suggests that despite the geopolitical noise, commercial logic continues to reassert itself. Against that backdrop it has been of note that the renminbi remains the strongest-performing major Asian currency year-to-date, a signal that confidence in the trade normalisation story retains some foundation. Whether this continues will depend on whether the current phase of diplomatic pragmatism holds.
Chart 6: Chinese Export Growth to the United States

Andrew Cates
AuthorMore in Author Profile »Andy Cates joined Haver Analytics as a Senior Economist in 2020. Andy has more than 25 years of experience forecasting the global economic outlook and in assessing the implications for policy settings and financial markets. He has held various senior positions in London in a number of Investment Banks including as Head of Developed Markets Economics at Nomura and as Chief Eurozone Economist at RBS. These followed a spell of 21 years as Senior International Economist at UBS, 5 of which were spent in Singapore. Prior to his time in financial services Andy was a UK economist at HM Treasury in London holding positions in the domestic forecasting and macroeconomic modelling units. He has a BA in Economics from the University of York and an MSc in Economics and Econometrics from the University of Southampton.
More Economy in Brief


