 Global| Aug 07 2025
Charts of the Week: Downside Risks
by:Andrew Cates
|in:Economy in Brief
Summary
Last week’s weaker-than-expected US labour market report—marked by sluggish payroll growth, rising unemployment, and downward revisions to prior months—sparked a notable shift in financial markets. Bond yields fell sharply as investors repriced the outlook for Fed easing, with rate cut expectations brought forward. This recalibration arguably reflects growing awareness of mounting downside risks across the US and broader global economy. Several indicators reinforce this view. Output gaps in many major economies are narrowing or turning negative, signalling that demand is falling short of potential (chart 1). The US housing market looks fragile, amidst weak builder sentiment and falling prices (chart 2). US bank lending standards are still restrictive, with implications for credit availability, household and business investment, and overall economic momentum (chart 3). Some (though not all) global sentiment surveys have softened, and positive growth surprises are now fading. Meanwhile, and despite earlier fears, US tariffs have not triggered renewed supply chain stress or inflationary pressures (chart 5). Add to that the ongoing deflation in China’s producer prices, and the macro narrative could be tilting more decisively toward slower growth and diminishing inflation risks—leaving policymakers with more space to continue easing monetary policy (chart 6).
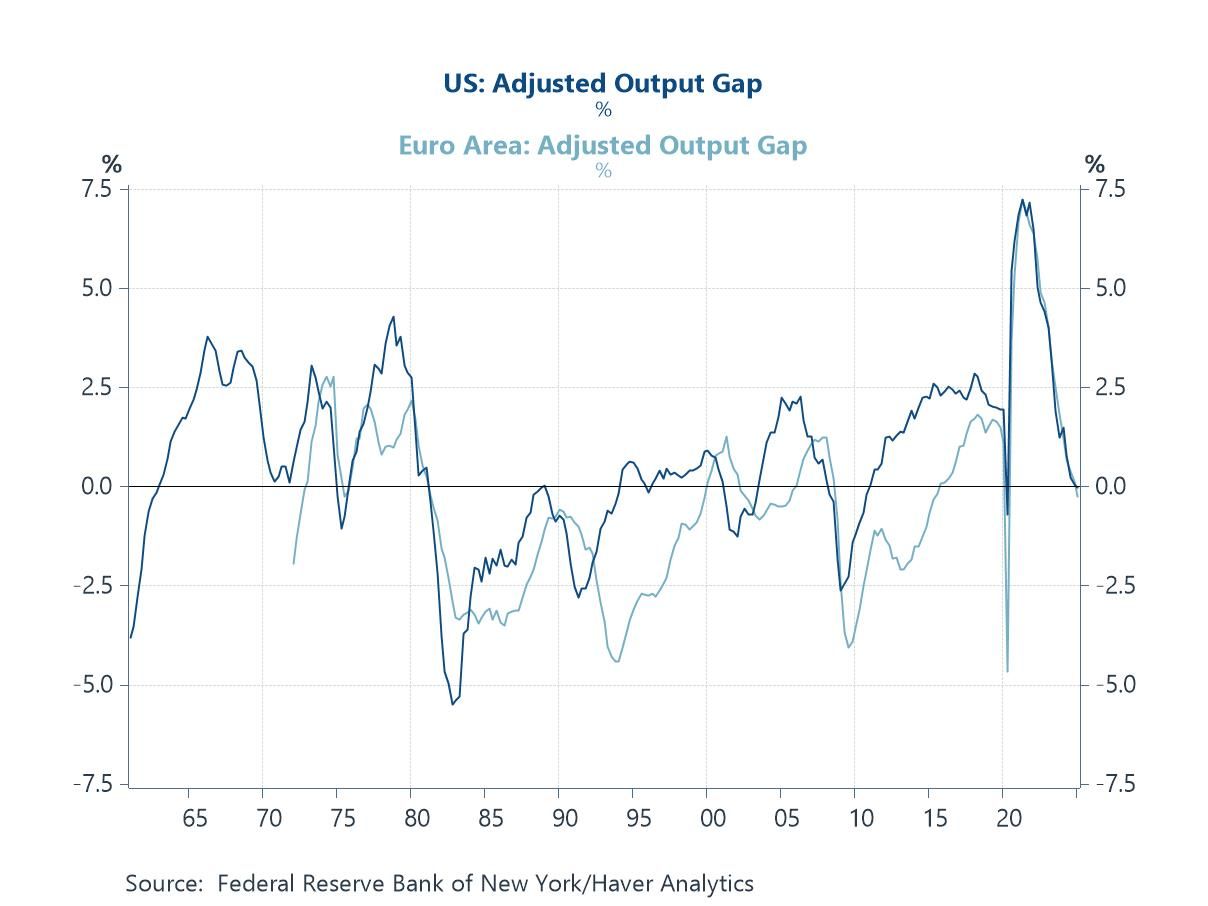
Capacity pressures in the US and Europe Output gaps in advanced economies (the US and euro area) are estimated to have narrowed sharply in recent months and could be on the verge of turning negative. This reflects a prior period of weaker growth and a growing degree of slack in the economy—conditions that typically translate into softer inflation and heightened pressure on central banks to ease policy. Labour markets are certainly showing greater signs of weakness in the US. A big caveat to this is that estimating output gaps is inherently difficult, especially after recent supply shocks and structural shifts in labour markets. Still, most real-time indicators now suggest aggregate demand is slipping below potential. And that, alongside weakening job data, is strengthening the case for further policy easing and hints at continued disinflation in the months ahead.
Chart 1: Estimated output gap in the US and Europe
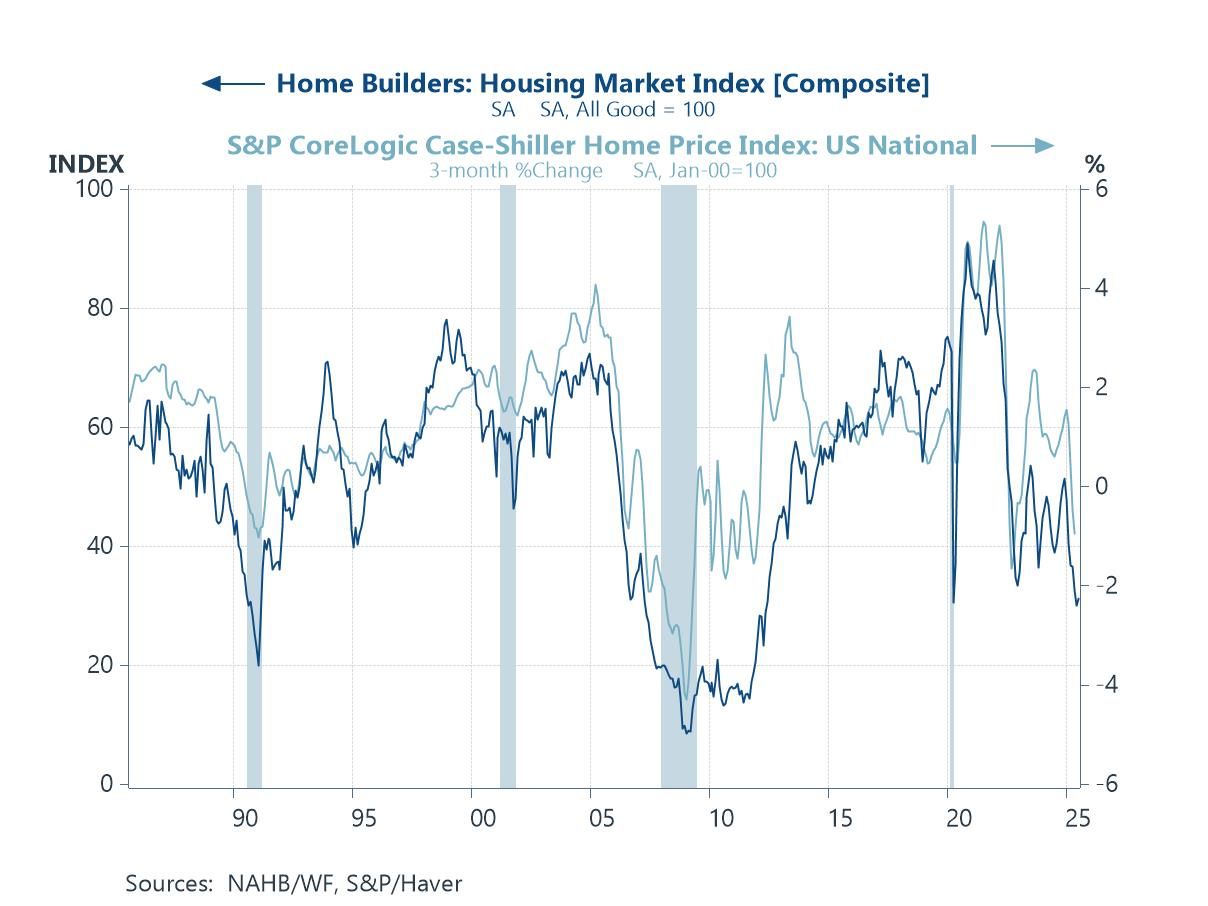
The US housing market US housing has long been a bellwether for broader economic conditions, largely because of its deep ties to credit creation, household balance sheets, and interest rates. That’s why the latest data showing a renewed slump in builder sentiment and a more sustained drop in house price momentum has been of note. With mortgage rates still elevated and lending standards – as we discuss below – still tight, the housing sector looks increasingly fragile—raising fresh concerns about the durability of US growth.
Chart 2: US NAHB homebuilders index versus house prices
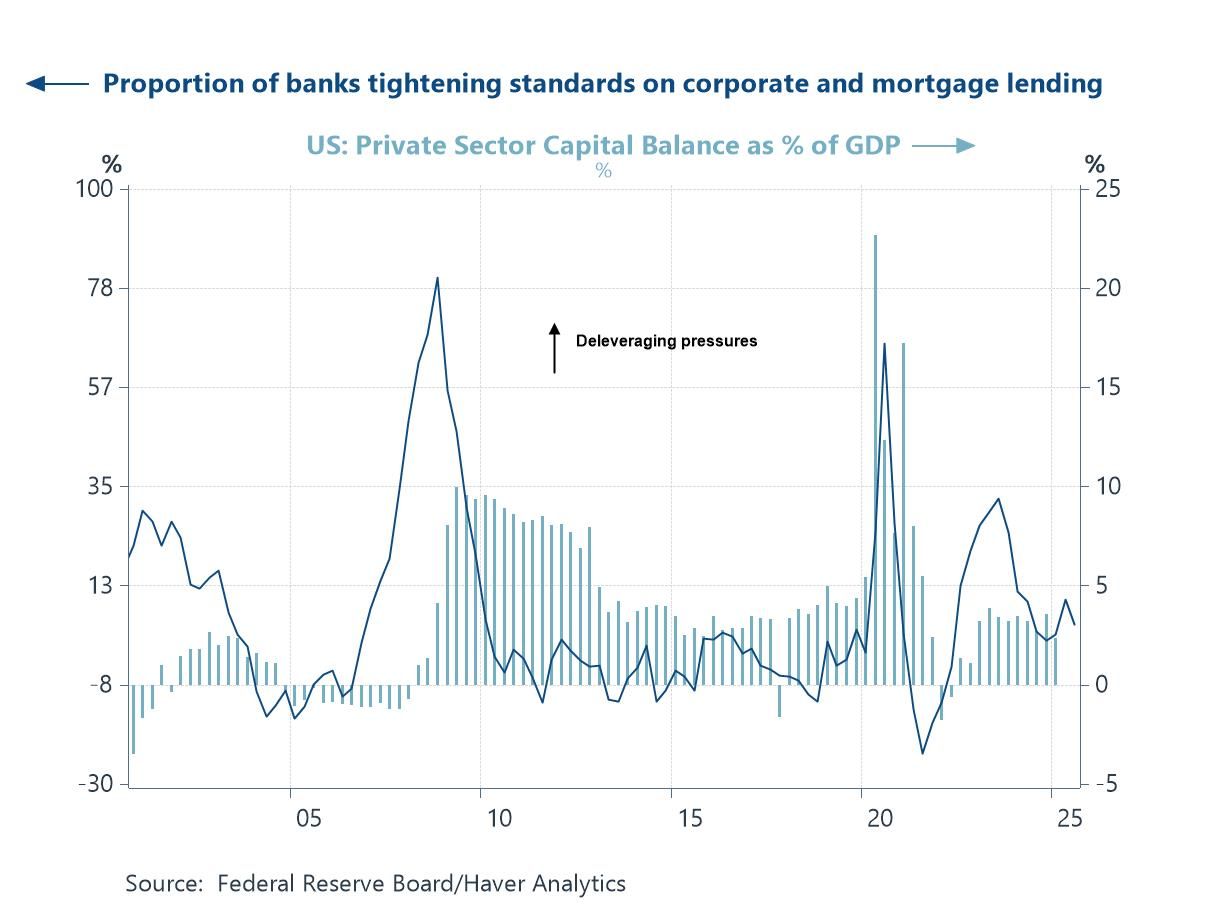
US bank lending standards This week’s latest Fed Senior Loan Officer Survey confirms that US credit conditions remain restrictive. Banks are still tightening lending standards for companies and consumers while loan demand continues to weaken—a pattern historically associated with periods of economic downturn. Although the net percentage of banks tightening standards has eased somewhat from 2023 peaks (see chart below), it remains elevated, and credit demand is now falling across most categories, from small business to commercial real estate. This tightening in credit supply and fall in demand suggests that monetary policy is still transmitting forcefully through the banking sector.
Chart 3: US bank lending standards versus the private sector savings balance
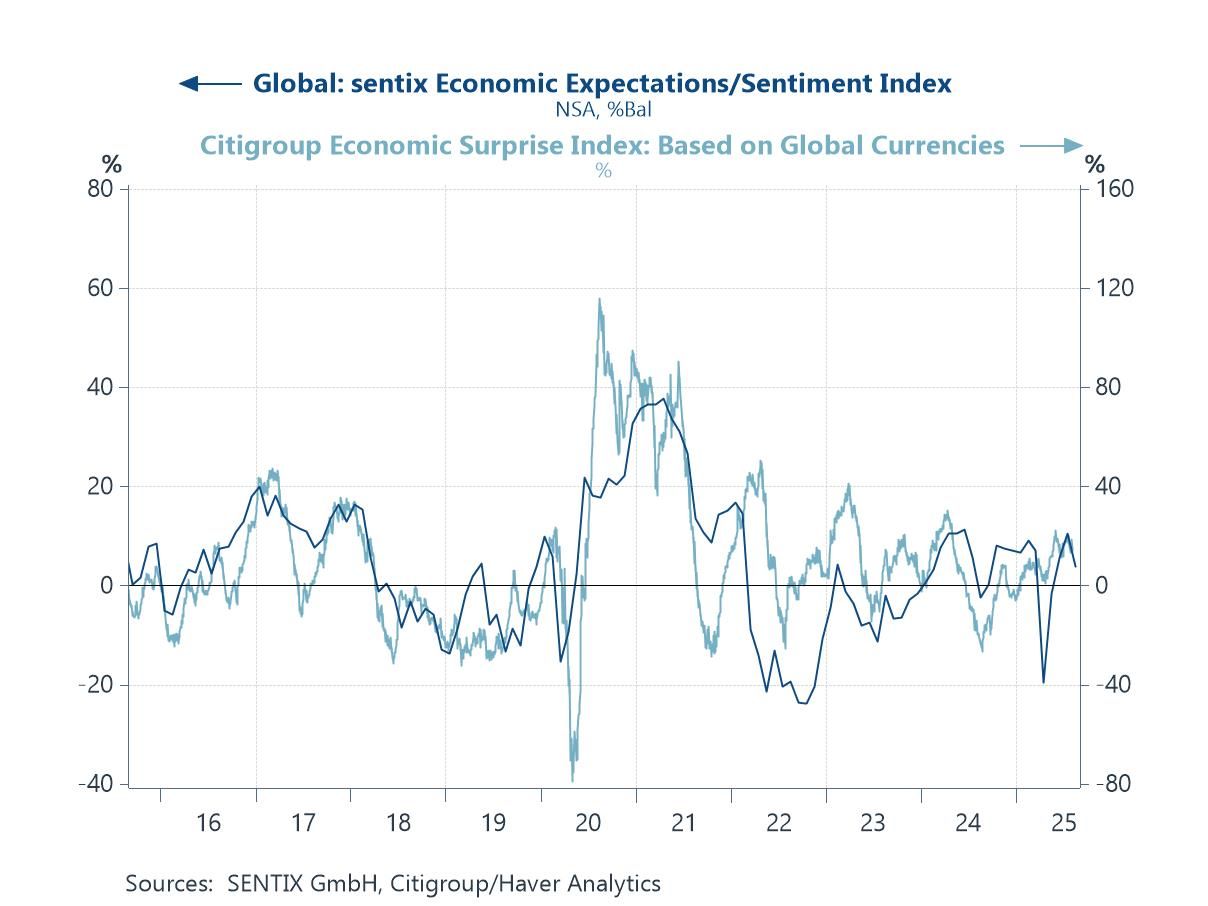
Global growth momentum Until recently, global economic surprises and sentiment surveys were broadly supportive, suggesting the global cycle still had momentum. But this week’s Sentix survey revealed a renewed drop in expectations for August. That decline, coupled with a fading Citi Economic Surprise Index, hints that global momentum may be weakening again. As forward-looking indicators start to roll over, investors and policymakers alike should be alert to a potential shift toward a more pronounced downturn.
Chart 4: Global sentix survey expectations versus Citigroup global growth surprise index
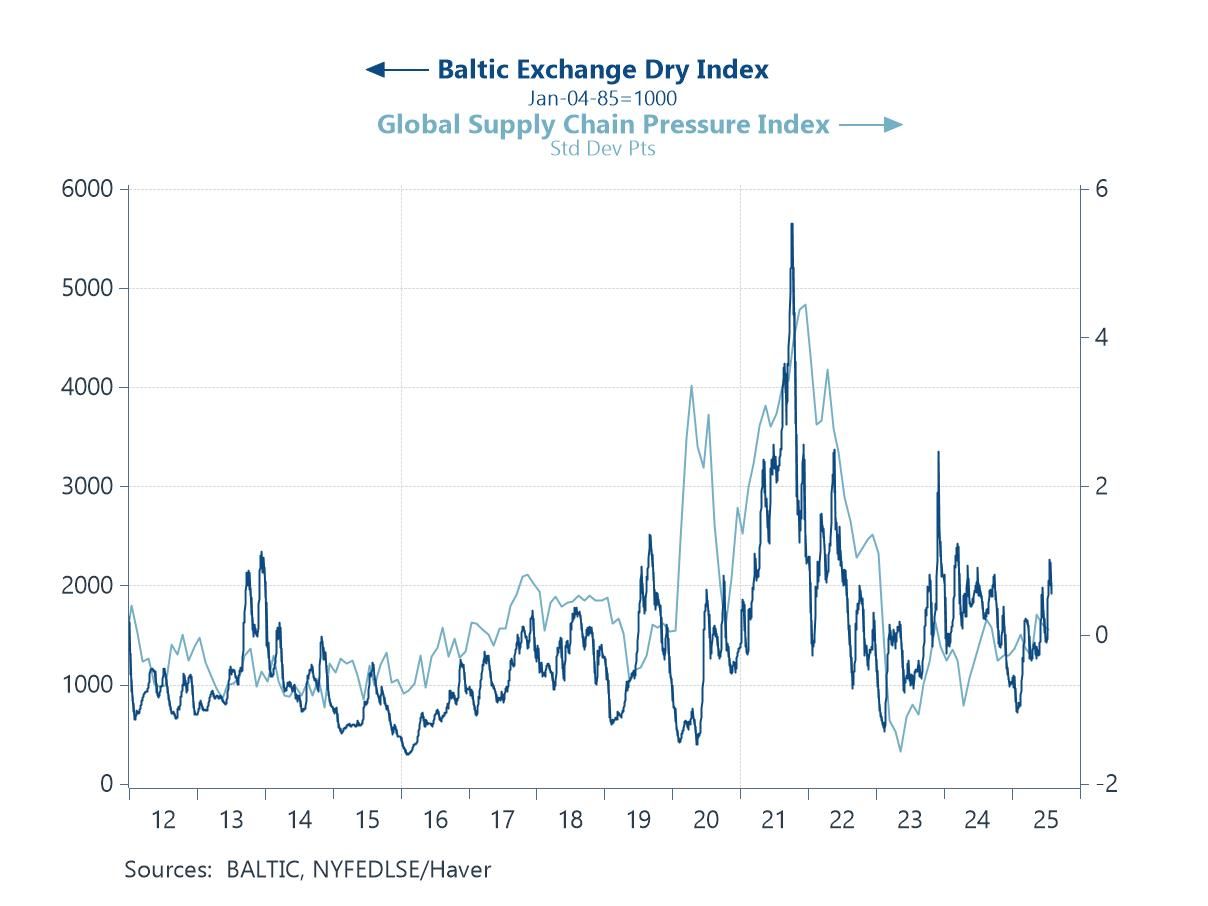
Global shipping costs and supply chain pressures One additional area of heightened investor concern of late has been the potential inflationary fallout from recent US tariff measures. But so far, there is little evidence – at the global level - to suggest that global supply chains or freight costs have been meaningfully disrupted. The Baltic Exchange Dry Index and the NY Fed’s Global Supply Chain Pressure Index both remain relatively subdued, indicating that logistics bottlenecks have not re-emerged.
Chart 5: Baltic dry index versus the Fed’s global supply chain pressure index
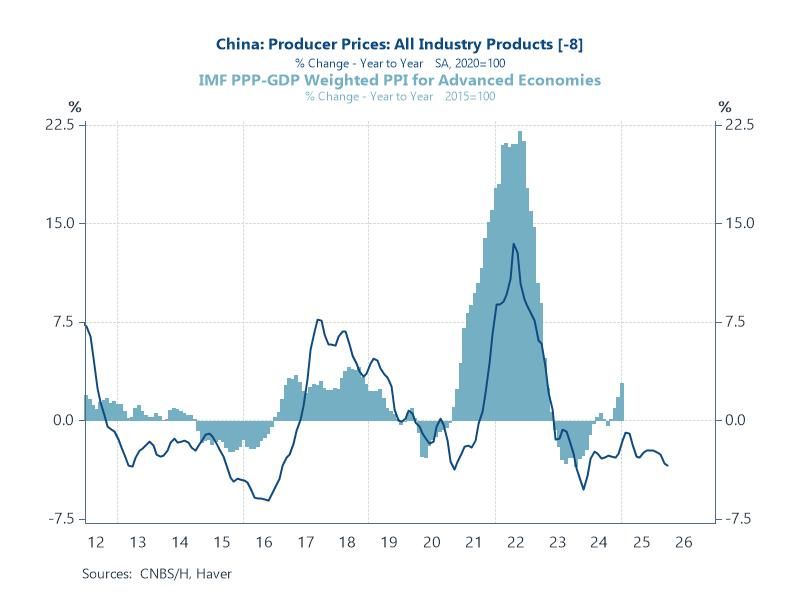
China’s excess capacity China’s economic influence remains pivotal in shaping global goods inflation. The latest data show that producer prices in China continue to contract, extending a prolonged period of deflation that reflects both domestic weakness and excess industrial capacity. This ongoing slack not only suppresses China’s export prices but also exerts downward pressure on global manufacturing input costs. At a time when central banks (most notably in the US) are weighing the risk of reacceleration in inflation, China’s persistent deflation in upstream prices acts as a powerful counterforce—reinforcing the view that goods inflation risks could remain subdued for now.
Chart 6: China’s PPI inflation versus global PPI inflation

Andrew Cates
AuthorMore in Author Profile »Andy Cates joined Haver Analytics as a Senior Economist in 2020. Andy has more than 25 years of experience forecasting the global economic outlook and in assessing the implications for policy settings and financial markets. He has held various senior positions in London in a number of Investment Banks including as Head of Developed Markets Economics at Nomura and as Chief Eurozone Economist at RBS. These followed a spell of 21 years as Senior International Economist at UBS, 5 of which were spent in Singapore. Prior to his time in financial services Andy was a UK economist at HM Treasury in London holding positions in the domestic forecasting and macroeconomic modelling units. He has a BA in Economics from the University of York and an MSc in Economics and Econometrics from the University of Southampton.
More Economy in Brief


