 Global| Feb 27 2008
US New Home Sales Off 57.7%, Midwest Sales Down 71.5%
by:Tom Moeller
|in:Economy in Brief
Summary
During January new single family home sales fell 2.8% m/m to 588,000. The decline dropped sales to the lowest level since 1995 and they were down 57.7% since the peak in July of 2005. A sales rate of 600,000 was the Consensus [...]
During January new single family home sales fell 2.8% m/m to 588,000. The decline dropped sales to the lowest level since 1995 and they were down 57.7% since the peak in July of 2005. A sales rate of 600,000 was the Consensus expectation for last month and January sales were nearly one quarter below the 2007 average.
Reflecting the weakness in the auto industry, sales in the Midwest fell 7.6% m/m to a level 71.5% below the 2003 peak. In the West sales actually ticked up slightly m/m in January but remained down 67.4% from the 2005 peak.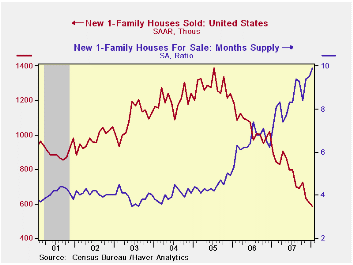
December sales in the South fell by 2.4% and were 53.9% below the 2005 peak. Sales in the Northeast fell 10.3% m/m and were 50% below the 2004 monthly peak.
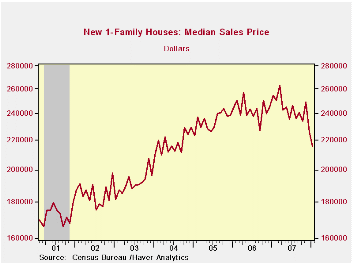
The median price for a new single family home fell again last month by 1.5%. That left prices down 17.7% from early 2007 peak.
The inventory of new homes for sale declined 2.2% last month and the supply of homes is off 15.9% from the 2005 peak.
The decline in the number of homes for sale continued to not keep pace with the drop in home sales. At the current low sales rate, the 9.9 months' supply of homes on the market was more than double the rate for all of 2005 and it was the highest since 1981.
Today's testimony by Federal Reserve Board Chairman Ben S. Bernanke can be found here.
| US New Homes | January | December | Y/Y | 2007 | 2006 | 2005 |
|---|---|---|---|---|---|---|
| Total Sales (SAAR, 000s) | 588 | 605 | -33.9% | 773 | 1,049 | 1,279 |
| Median Price (NSA, $) | 216,000 | 219,200 | -15.1% | 242,383 | 243,067 | 234,208 |
by Tom Moeller February 27, 2008

New orders for durable manufactured goods dropped 5.3% last month. The decline only slightly exceeded Consensus expectations for a large 4.0% downdraft but the surge during December was revised down. The weakness in orders was heralded by the orders component in the Institute for Supply Management's Composite Index of factory sector activity. It was below the breakeven level of 50 in both December and January.
Excluding the notably volatile transportation sector, orders fell 1.6% and the December increase of 2.0% was revised down.
Transportation sector orders fell 13.4% due both to a 31.0% (+79.3% y/y decline in new orders for aircraft & parts and a 0.8% (-5.8% y/y) decline in orders for motor vehicles parts. The nondefense portion of aircraft orders collapsed 30.5% (+86.6% y/y).
Orders for nondefense capital goods fell 8.1% due to that decline in aircraft orders. During the last ten years there has been an 80% correlation between the y/y gain in nondefense capital goods orders and the rise in equipment & software spending in the GDP accounts. The correlation with capital goods shipments is, as one would expect, a larger 92%.
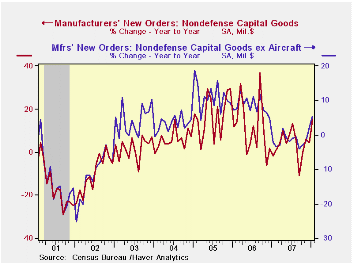
During January orders for nondefense capital goods less aircraft fell 1.4% after a 5.2% December surge. Growth in these orders actually has accelerated recently with the three month rise up to 15.5% (AR) which made up a decline this past Fall.
Computers & related products orders fell 11.7% (+0.8% y/y) and gave back all of the 5.1% December rise. Orders for communications equipment dropped 11.9% (+3.5% y/y). Orders for machinery slipped 1.5% (+14.6% y/y) after the 7.8% December spike.
Overall shipments of durable goods last month rose 1.8% (2.8% y/y). Less transportation shipments 1.5% (3.5% y/y).
Inventories of durable goods rose 0.6% (3.7% y/y). Less transportation inventories rose a firm 0.4% and the three month increase was a strong 4.7% (AR).
Yesterday's speech by Federal Reserve Board Vice Chairman Donald L. Cohn can be found here.
| NAICS Classification | January | December | Y/Y | 2007 | 2006 | 2005 |
|---|---|---|---|---|---|---|
| Durable Goods Orders | -5.3% | 4.4% | 3.8% | 0.9% | 6.3% | 9.9% |
| Excluding Transportation | -1.6% | 2.0% | 3.1% | 0.2% | 7.6% | 8.8% |
| Nondefense Capital Goods | -8.1% | 5.5% | 14.9% | 3.5% | 10.6% | 17.1% |
| Excluding Aircraft | -1.4% | 5.2% | 5.4% | -1.6% | 8.5% | 11.1% |
by Tom Moeller February 27, 2008
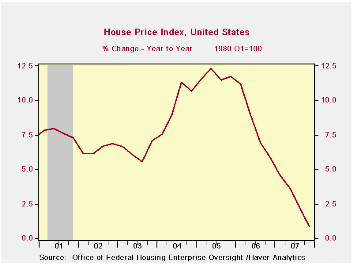
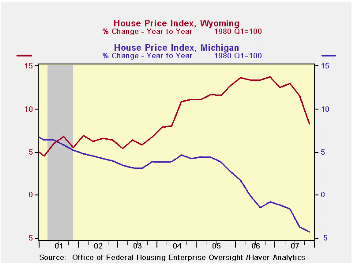
According to the Office of Federal Housing Enterprise Oversight (OFHEO) home prices in the U.S. rose just 0.1% last quarter. That rounded out a year end gain of just 0.8%, and of 2.8% for the full year. These rates of increase were the slowest since the 1990s, although the slowing did follow gains earlier this decade which were the strongest since the late 1970s.
The House Price Indices in this report are weighted indexes based on repeat sales or refinancings using data provided by Fannie Mae or Freddie Mac. The overall figures are available in Haver's USECON data base and the state figures are in US REGIONAL
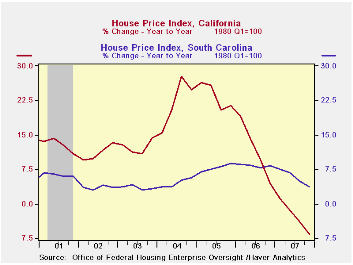
Home price performance varied greatly last year across the country to net out at the slight 0.8% overall uptick. Down hard were home prices in California though rates of appreciation slowed most every where. A 6.6% decline in prices 4Q/4Q was followed just barely by a 4.7% rate of decline in Florida. These declines pulled prices down for the full year but both annual shortfalls followed double digit gains in 2006. That was not, however, the pattern in Michigan where prices have declined steadily since 2005.
If prices in other regions did rise 4Q/4Q the rates of increase were down most everywhere. New York squeezed out a 0.7% price increase last year but it followed much more respectable gains in 2006 and 2005. The same pattern was true for neighboring New Jersey and Pennsylvania.
In the South and certainly in the West, other than in California, home price appreciation barely took a breadth. For the full year 2007, double digit gains in Wyoming were accompanied by respectable price increases in Texas and South Carolina. Neighboring North Carolina and Tennessee did well as well.
The latest report from the Office of Federal Housing Enterprise Oversight (OFHEO) can be found here.
| House Price Index (OFHEO, %) | 4Q '07 | 3Q '07 | Y/Y | 2007 | 2006 | 2005 |
|---|---|---|---|---|---|---|
| United States | 0.1 | -0.2 | 0.8 | 2.8 | 8.2 | 11.8 |
| California | -3.1 | -1.9 | -6.6 | -2.7 | 11.5 | 23.3 |
| Florida | -1.7 | -2.1 | -4.7 | -0.3 | 17.2 | 25.6 |
| Michigan | 0.1 | -2.5 | -4.3 | -2.7 | -0.2 | 3.9 |
| Massachusetts | 0.8 | -1.4 | -2.2 | -1.6 | 1.9 | 9.7 |
| Wyoming | 0.3 | 2.7 | 8.3 | 11.2 | 13.5 | 11.8 |
| Texas | 0.7 | 1.0 | 5.2 | 6.4 | 6.3 | 4.6 |
| South Carolina | 1.6 | 0.1 | 3.8 | 5.7 | 8.3 | 7.8 |
| New York | 0.6 | -0.6 | 0.7 | 2.2 | 8.2 | 13.4 |
by Robert Brusca February 27, 2008
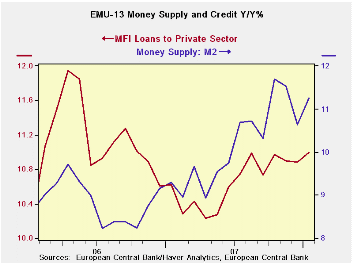
The table below shows Euro area money and credit growth comparing it to money growth in several key countries. We also provide data on real balances (inflation-adjusted money and credit). Despite ongoing financial turmoil, here data show that there has been little slowing in EMU money and credit. Credit to residents has slowed a touch over the three months compared to six-month and one-year rates. Overall business loan growth in EMU has barely slowed.
Money growth has held up around the various main global money centers as well. Unexpectedly, the growth in real money in EMU has been stronger than in the US where it is off by 0.1% over three months. Over 12 months US M2 is up at just a pace of 1.4% compared to 7.9% in the EMU. Real money growth in the UK is quite steady. In Japan real money growth is slow but is being held fairly steady.
The memo item on the right of the table shows how relentless the rise has been in the price of crude oil in these various periods. Central banks have done a really impressive job in running policy amid this ongoing energy shock as well and a new shock stemming from food prices.
Judging by interest rate policy, monetary policy in the US is loose. But judging from the growth in real balances, US monetary policy is tighter than in UK, EMU or Japan over three months and tied with Japan for stringency over the past year.
| Look at Global and Euro Liquidity Trends | |||||||
|---|---|---|---|---|---|---|---|
| Saar-all | Euro Measures (EA13): Money & Credit | G-10 Major Markets: Money | Memo | ||||
| €€-Supply M2 | Credit:Resid | Loans | $US M2 | ££UK M4 | ¥¥Jpn M2+Cds | OIL:WTI | |
| 3-MO | 9.8% | 10.8% | 10.3% | 6.7% | 12.6% | 2.9% | 41.6% |
| 6-MO | 11.4% | 13.1% | 10.7% | 6.4% | 11.6% | 2.2% | 58.2% |
| 12-MO | 11.3% | 12.9% | 11.0% | 5.8% | 12.5% | 2.1% | 69.6% |
| 2Yr | 6.7% | 12.2% | 10.8% | 5.5% | 12.8% | 1.5% | 19.1% |
| 3Yr | 15.0% | 17.9% | 16.4% | 8.0% | 19.4% | 2.4% | 40.9% |
| Real Balances: deflated by Own CPI. Oil deflated by US CPI | |||||||
| 3-MO | 5.1% | 6.0% | 5.6% | -0.1% | 9.7% | 0.8% | 32.6% |
| 6-MO | 7.1% | 8.7% | 6.4% | 1.6% | 8.5% | 0.8% | 51.1% |
| 12-MO | 7.9% | 9.5% | 7.6% | 1.4% | 10.1% | 1.3% | 62.4% |
| 2Yr | 7.6% | 9.4% | 8.1% | 2.2% | 10.1% | 1.1% | 15.4% |
| 3Yr | 7.1% | 8.9% | 8.0% | 1.7% | 10.0% | 1.4% | 21.5% |
by Robert Brusca February 27, 2008
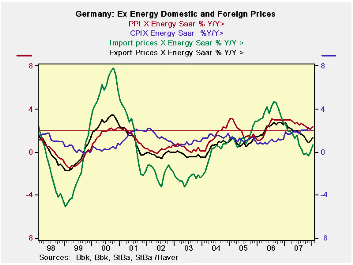
German export and import prices are rising very strongly in January and the three-month growth rates show acceleration. But jettison energy, export and import price trends are a lot steadier, still showing some acceleration in the recent months. Excluding energy, import prices are still accelerating from a growth rate of 0.7% over 12 months to 1.4% over six months to 2.4% over three months. This sort of acceleration will not please the ECB but given the tenacious rise in oil prices this performance is not so bad.
| German International and Domestic Inflation Trends | |||||||
|---|---|---|---|---|---|---|---|
| % m/m | % Saar | ||||||
| SA | Jan-08 | Dec-07 | Nov-07 | 3-Mo | 6-Mo | 12-Mo | Yr-Ago |
| Export P | 0.7% | 0.1% | 0.2% | 3.8% | 2.1% | 1.8% | 2.4% |
| Import P | 0.6% | 0.4% | 1.3% | 9.5% | 5.2% | 5.4% | 0.5% |
| NSA | |||||||
| ExpX-Petrol | 0.7% | 0.0% | -0.1% | 2.3% | 1.1% | 1.3% | 2.7% |
| ImpX-Petrol | 0.9% | 0.1% | -0.4% | 2.4% | 1.4% | 0.7% | 2.7% |
| Memo: SA | |||||||
| CPI | 0.4% | -0.3% | 0.6% | 2.9% | 2.7% | 2.7% | 1.7% |
| CPIx-energy | #N/A | 0.1% | 0.2% | #N/A | #N/A | #N/A | 1.9% |
| PPI | 0.7% | 0.0% | 0.9% | 6.9% | 4.6% | 3.2% | 3.2% |
| PPIx-Energy | 0.4% | 0.1% | 0.1% | 2.2% | 2.2% | 2.4% | 3.0% |

Tom Moeller
AuthorMore in Author Profile »Prior to joining Haver Analytics in 2000, Mr. Moeller worked as the Economist at Chancellor Capital Management from 1985 to 1999. There, he developed comprehensive economic forecasts and interpreted economic data for equity and fixed income portfolio managers. Also at Chancellor, Mr. Moeller worked as an equity analyst and was responsible for researching and rating companies in the economically sensitive automobile and housing industries for investment in Chancellor’s equity portfolio. Prior to joining Chancellor, Mr. Moeller was an Economist at Citibank from 1979 to 1984. He also analyzed pricing behavior in the metals industry for the Council on Wage and Price Stability in Washington, D.C. In 1999, Mr. Moeller received the award for most accurate forecast from the Forecasters' Club of New York. From 1990 to 1992 he was President of the New York Association for Business Economists. Mr. Moeller earned an M.B.A. in Finance from Fordham University, where he graduated in 1987. He holds a Bachelor of Arts in Economics from George Washington University.
More Economy in Brief


