 Global| Mar 14 2007
US Export and Import Prices Show Their Soft Side
Summary
Ex-petroleum import prices fell by 0.1% in February. Good news for core inflation trends. The 1Yr, 6-Mo, 3-mo progression of annualized inflation pressures also show that there is no pressure building. Yr/Yr non-petroleum import [...]
Ex-petroleum import prices fell by 0.1% in February. Good news for core inflation trends. The 1Yr, 6-Mo, 3-mo progression of annualized inflation pressures also show that there is no pressure building. Yr/Yr non-petroleum import prices are up by 2.1%; looking over 3-mos annualized the gain is just 1.1%. Tame. Nonagricultural export prices show a bit more lift than that, partly aided by pressure from industrial supplies and materials, an export category that does contain some oil.
Looking more directly at prices that feed into consumer prices (look at the import figures), we see a bit of lift for consumer prices excluding vehicles and for foods and beverages. Vehicle import prices are under wraps. For the most part it does not look like there is an inflation impulse leaking in for the international sector.
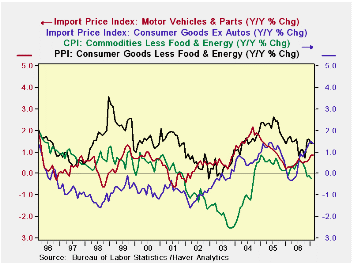
The chart on the left shows some key consumer goods price relationships. We plot import prices for vehicles and for consumer goods excluding vehicles Vs the CPI core for goods and the PPI consumer goods core. The PPI tends to show the highest gains; this index measures price for core consumer goods produced in the US. The Core CPI for goods consists of these products taken to the next level of distribution, adding consumer goods imports. That results in a core goods CPI index that has showed lower inflation than most other indexes since about August 2002. Nonvehicle consumer prices were, at one time, the slowest inflators on the block, but that changed in August of 2002. While the two international indexes do not show much in the way of inflation it is also true that vehicle imports and nonvehicle consumer goods imports sport higher inflation rates that the core CPI by itself and have been so for about one year . And the consumer core of the PPI is ‘ramping up’ albeit none of these yr/yr gains exceeds even 2% y/y yet. If it’s inflation in the making, it is still quite mild. The trends maybe less than reassuring but the degree of inflation that is in train remains quite MILD.
| Imports | Exports | ||||||
| SAAR | All | Petrol | Excl Petrol | SAAR | All | Agric | NonAgric |
| 3-MO | 1.8% | -11.2% | 1.1% | 3-MO | 7.0% | 22.9% | 5.9% |
| 6-MO | -7.4% | -38.8% | 1.5% | 6-MO | 2.9% | 22.3% | 1.4% |
| Yr/Yr | 1.3% | -5.5% | 2.1% | Yr/Yr | 4.7% | 16.9% | 3.7% |
| 2-Yrs | 4.1% | 18.0% | 1.9% | 2-Yrs | 3.7% | 10.6% | 3.2% |
| MO/MO | 0.2% | 2.0% | -0.1% | MO/MO | 0.7% | 2.3% | 0.6% |

Robert Brusca
AuthorMore in Author Profile »Robert A. Brusca is Chief Economist of Fact and Opinion Economics, a consulting firm he founded in Manhattan. He has been an economist on Wall Street for over 25 years. He has visited central banking and large institutional clients in over 30 countries in his career as an economist. Mr. Brusca was a Divisional Research Chief at the Federal Reserve Bank of NY (Chief of the International Financial markets Division), a Fed Watcher at Irving Trust and Chief Economist at Nikko Securities International. He is widely quoted and appears in various media. Mr. Brusca holds an MA and Ph.D. in economics from Michigan State University and a BA in Economics from the University of Michigan. His research pursues his strong interests in non aligned policy economics as well as international economics. FAO Economics’ research targets investors to assist them in making better investment decisions in stocks, bonds and in a variety of international assets. The company does not manage money and has no conflicts in giving economic advice.
More Economy in Brief


