 Global| Jan 30 2008
US 4Q GDP Weaker Than Expected At 0.6%. Exports & Inventories Added Less
by:Tom Moeller
|in:Economy in Brief
Summary
U.S. real GDP in the last quarter of 2007 rose at a 0.6% annual rate. The figure from the Commerce Department contrasted slightly with the Consensus expectation for a 1.2% advance. The figure contrasted sharply, however, with an [...]
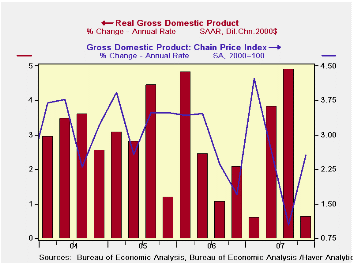
U.S. real GDP in the last quarter of 2007 rose at a 0.6% annual rate. The figure from the Commerce Department contrasted slightly with the Consensus expectation for a 1.2% advance. The figure contrasted sharply, however, with an average rate of growth during the prior two quarters of 4.4%.
Each of the economy's sectors including domestic demand, foreign trade and inventories contributed to the slowdown.
Inventories subtracted 1.3 percentage
points from 4Q GDP growth as a rate of accumulation turned negative.
That contrasted with an average 0.6 percentage point addition during 2Q
& 3Q.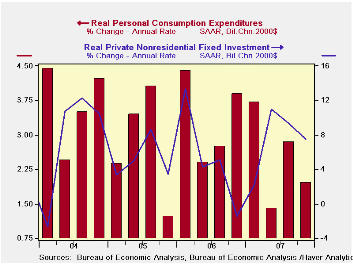
An improved foreign trade account added much less to real GDP growth last quarter. The 0.4 point addition was down from an average 1.4 percentage point contribution during the prior two quarters. Growth in exports slowed to a still quite firm 10.2% rate from 18.3% and that meant that exports contributed just 0.5 percentage points to GDP, half the 1.5 point add during the two prior periods. Real imports grew 13.1%, a very slight pickup from 10.5% growth during 2Q & 3Q. That sapped 0.1 points from GDP growth, the same as during the prior two quarters.
Financial Globalization and the U.S. Current Account Deficit from the Federal Reserve Bank of New York can be found here.
Growth in final sales to domestic purchasers totaled just 1.4%, down from a 2.3% rate of advance during the prior two quarters. The decline in residential construction at a -23.9% rate was an acceleration from a -16.3% rate during the prior two quarters. It was notable in that it pulled 1.2 percentage points out of GDP growth versus a 0.9 point lowering during 2Q & 3Q. The slowdown in growth in business fixed investment to a 7.5% rate from a 2 Qtr change of 10.2% also was notable in that it added a lesser 0.8 percentage points last quarter versus 1.0 points during the prior two. Growth in real personal consumption held fairly steady at a 2.0% rate of growth versus an average of 2.1% in 2Q & 3Q. That added 1.4 percentage points to growth last quarter in contrast to a 1.5 point add during the prior two.
The GDP chain price index rose 2.6% (AR), up from a 1.8% rate of advance during the prior two quarters. The PCE price index grew at a 3.9% rate. That was up a point from the prior two quarters not only due to higher energy prices. Less food & energy, a measure relevant to those who don't eat or drive, rose at an accelerated 2.7% rate versus an average 1.7% rate in 2Q & 3Q.
| Chained 2000$, % AR | 4Q '07 | 3Q '07 | Y/Y | 2007 | 2006 | 2005 |
|---|---|---|---|---|---|---|
| GDP | 0.6 | 4.9 | 2.5 | 2.2 | 2.9 | 3.1 |
| Inventory Effect | -1.3 | 0.9 | -0.2 | -0.3 | 0.1 | -0.2 |
| Final Sales | 1.9 | 4.0 | 2.7 | 2.5 | 2.8 | 3.3 |
| Foreign Trade Effect | 0.4 | 1.4 | 0.8 | 0.7 | -0.1 | -0.2 |
| Domestic Final Demand | 1.4 | 2.5 | 1.9 | 1.8 | 2.7 | 3.3 |
| Chained GDP Price Index | 2.6 | 1.0 | 2.6 | 2.7 | 3.2 | 3.2 |
by Tom Moeller January 30, 2008
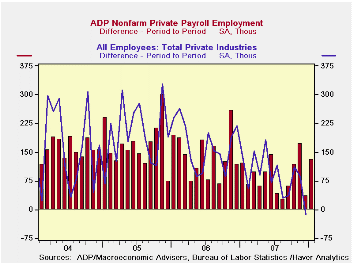
The ADP National Employment Report, reported by the payroll processor, indicated that private nonfarm payroll growth improved sharply to 130,000 in January from a revised 37,000 worker advance in December.
The U.S. Bureau of Labor Statistics employment figure for January will be published this coming Friday.Last month, the 37,000 gain ADP's measure of private nonfarm payrolls was followed by a decline of 13,000 in the BLS measure of private nonfarm payrolls.
According to ADP and Macro Advisers, the correlation between the monthly percentage change in the ADP estimate and that in the BLS data is 0.90
The ADP sub-index for large payrolls nudged up 8,000 after a 35,000 worker collapse during December
Medium sized payrolls showed great improvement by 52,000 after
a 5,000 December increase.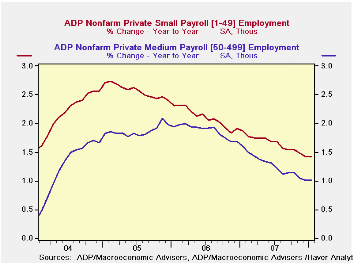
Growth in small payrolls of 70,000 was near the very recent rate but there has been a halving of the annual growth rate over the last three years.
Employment in the goods producing industries continued to decline (-1.7% y/y) while services rose (1.5% y/y).
ADP compiled the estimate from its database of individual companies' payroll information. Macroeconomic Advisers, LLC, the St. Louis economic consulting firm, developed the methodology for transforming the raw data into an economic indicator.
The ADP National Employment Report data is maintained in
Haver's USECON database; historical data
go back to December 2000. The figures in this report cover only private
sector jobs and exclude employment in the public sector, which rose an
average 11,083 during the last twelve months.
The full ADP National Employment Report can be found here, and the ADP methodology is explained here.
| LAXEPA@USECON | January | December | Y/Y | 2006 | 2005 | 2004 |
|---|---|---|---|---|---|---|
| Nonfarm Private Payroll Employment (m/m Chg.) | 130,000 | 37,000 | 0.9% | 1.7% | 1.8% | 1.3% |
by Tom Moeller January 30, 2008
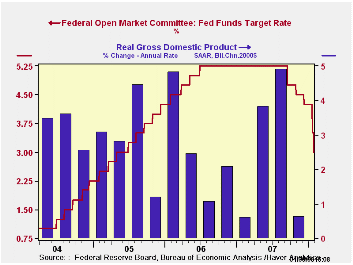
The Federal Open Market Committee today lowered the Federal funds rate by fifty basis points to 3.0%. The move was as expected following the seventy-five basis point reduction last week. The rate was last at 3.0% in June of 2005.
The discount rate also was reduced fifty basis points to 3.50%.
The Fed indicated that "Financial markets remain under considerable stress, and credit has tightened further for some businesses and households. Moreover, recent information indicates a deepening of the housing contraction as well as some softening in labor markets."
The Fed further indicated that "The Committee will continue to assess the effects of financial and other developments on economic prospects and will act in a timely manner as needed to address those risks."
Voting against taking the action was Richard W. Fisher, President of the Federal Reserve Bank of Dallas, who preferred no change in the target for the federal funds rate at this meeting.
For the complete text of the Fed's latest press release please follow this link.
Credit Derivatives: An Overview from the Reserve Bank of Atlanta can be found here.
Booms and Busts: The Case of Subprime Mortgages from the Federal Reserve Bank of Kansas City is available here.
Case-Shiller Home Price IndexLowest Since 2005by Tom Moeller January 30, 2008
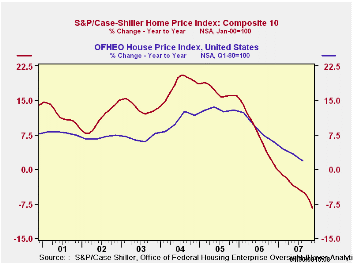
According to the S&P/Case-Shiller Composite 10 home price index, U.S. home prices fell another 2.2% m/m in November to the lowest level since April 2005. Home prices have fallen in every month since June of 2006 and the total decline over that period amounts to 9.4%. The November decline pulled the y/y comparison to a negative 8.4%.
The index of 10 U.S. cities and their surrounding areas is not adjusted for the quality or the size of the home. The home price index from the Office of Federal Housing Enterprise Oversight (OFHEO) does make these adjustments. This series indicates that through the third quarter home prices still were rising, but at a reduced 1.8% y/y rate.
The composite index of homes in 20 metropolitan areas fell 2.1% (-7.7% y/y) last month.
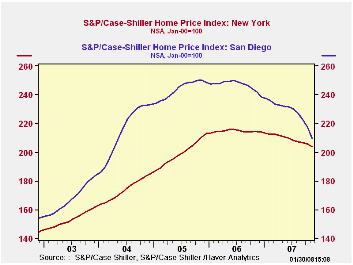 Home prices in San Diego California continued quite weak and
registered a 13.4% y/y decline and they have fallen 16.3% from the late
2005 peak. Prices in Miami Florida also are down sharply, by 15.1% y/y.
Home prices in Las Vegas Nevada registered a 13.2% y/y decline and in
Los Angeles prices fell 11.9% y/y.
Home prices in San Diego California continued quite weak and
registered a 13.4% y/y decline and they have fallen 16.3% from the late
2005 peak. Prices in Miami Florida also are down sharply, by 15.1% y/y.
Home prices in Las Vegas Nevada registered a 13.2% y/y decline and in
Los Angeles prices fell 11.9% y/y.
Relatively moderate declines were registered in New York (-4.8% y/y), Chicago (-3.39% y/y) and Denver (-3.1%).
An overview of the S&P/Case-Shiller home price series can be found here.
The S&P/Case-Shiller home price series can be found in Haver's REGIONAL database.
Masters of Illusion from the Federal Reserve Bank of Minneapolis explores why home prices soar in both high and low inflation eras? It is available here.
| S&P/Case-Shiller Home Price Index (NSA, Jan 00 = 100) | November | October | Y/Y | 2006 | 2005 | 2004 |
|---|---|---|---|---|---|---|
| Ten City Composite Index | 205.09 | 209.75 | -8.4% | 224.56 | 209.16 | 178.90 |

Tom Moeller
AuthorMore in Author Profile »Prior to joining Haver Analytics in 2000, Mr. Moeller worked as the Economist at Chancellor Capital Management from 1985 to 1999. There, he developed comprehensive economic forecasts and interpreted economic data for equity and fixed income portfolio managers. Also at Chancellor, Mr. Moeller worked as an equity analyst and was responsible for researching and rating companies in the economically sensitive automobile and housing industries for investment in Chancellor’s equity portfolio. Prior to joining Chancellor, Mr. Moeller was an Economist at Citibank from 1979 to 1984. He also analyzed pricing behavior in the metals industry for the Council on Wage and Price Stability in Washington, D.C. In 1999, Mr. Moeller received the award for most accurate forecast from the Forecasters' Club of New York. From 1990 to 1992 he was President of the New York Association for Business Economists. Mr. Moeller earned an M.B.A. in Finance from Fordham University, where he graduated in 1987. He holds a Bachelor of Arts in Economics from George Washington University.
More Economy in Brief


