 Global| Feb 28 2008
US 4Q GDP Held at 0.6% Growth
by:Tom Moeller
|in:Economy in Brief
Summary
U.S. real GDP growth during last quarter was unrevised at a 0.6% annual rate. The Commerce Department figure was just slightly below the Consensus expectation for an upward revision to a 0.8% rise. The gain still was down sharply from [...]
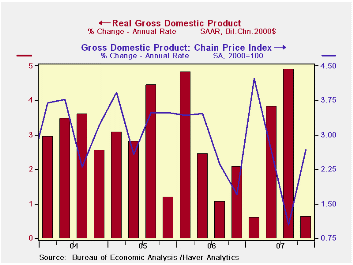
U.S. real GDP growth during last quarter was unrevised at a 0.6% annual rate. The Commerce Department figure was just slightly below the Consensus expectation for an upward revision to a 0.8% rise. The gain still was down sharply from an average rate of growth during the prior two quarters of 4.4%.
As expected, improvement in the foreign trade deficit added more to growth last quarter as imports are now shown to have declined at a 1.9% rate, rather than rise sharply. Export growth also was revised slower to 4.8%.
Half of the addition to GDP growth from trade was offset by more of a subtraction from inventory decumulation.
The remaining half of the revision stemmed from slower
estimated growth in final sales to domestic purchasers.
The decline in residential construction was
deepened slightly to -25.2% (-18.6% y/y) and that pulled 1.3 percentage
points out of GDP growth. Growth in business fixed investment
also was revised slightly slower to a 6.9% rise. Growth in real
personal consumption was held about steady at 1.9%.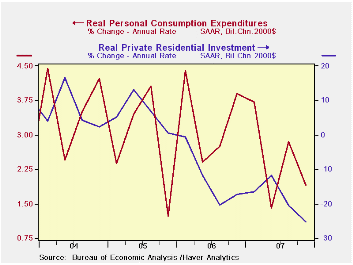
Growth in the GDP chain price index was added to slightly to a 2.7% (AR) gain. The PCE price index rose at a 4.1% rate which was revised up very slightly. Less food & energy prices rose at the same 2.7% rate as initially estimated.
Monetary Policy Actions and Long-Run Inflation Expectations is from the Federal Reserve Board and it can be found here.
| Chained 2000$, % AR | 4Q '07 (Preliminary) | 4Q '07 (Advance) | 3Q '07 | Y/Y | 2007 | 2006 | 2005 |
|---|---|---|---|---|---|---|---|
| GDP | 0.6 | 0.6 | 4.9 | 2.5 | 2.2 | 2.9 | 3.1 |
| Inventory Effect | -1.5 | -1.3 | 0.9 | -0.2 | -0.3 | 0.1 | -0.2 |
| Final Sales | 2.1 | 1.9 | 4.0 | 2.7 | 2.5 | 2.8 | 3.3 |
| Foreign Trade Effect | 0.9 | 0.4 | 1.4 | 0.8 | 0.7 | -0.1 | -0.2 |
| Domestic Final Demand | 1.2 | 1.4 | 2.5 | 1.9 | 1.8 | 2.7 | 3.3 |
| Chained GDP Price Index | 2.7 | 2.6 | 1.0 | 2.6 | 2.7 | 3.2 | 3.2 |
by Tom Moeller February 28, 2008
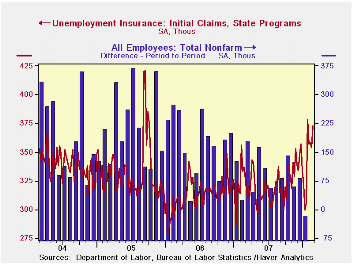
Initial claims for unemployment insurance rose a sharp 1,900 to 373,000 last week. During February claims have averaged 361,000, up 10.4% from the January average. The latest weekly level remained near the highest since October of 2005.
The four-week moving average of initial claims, a measure which smoothes out most of the series' w/w volatility, dipped slightly to 360,500 (+7.6% y/y).
A claims level below 400,000 typically has been associated with growth in nonfarm payrolls. During the last ten years there has been a (negative) 76% correlation between the level of initial claims and the m/m change in nonfarm payroll employment.
Continuing claims for unemployment insurance again rose
sharply by 21,000 after a 49,000 increase during the prior week that
was revised marginally higher. Insured unemployment stood at its
highest level since Summer 2005. The figure provides some indication of
workers' ability to find employment.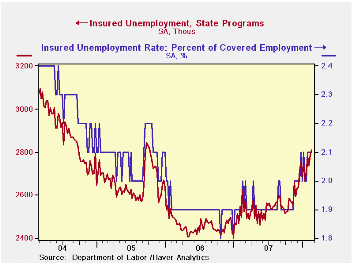
The continuing claims numbers lag the initial claims figures by one week.
The insured rate of unemployment remained at 2.1% for the fourth consecutive week.
| Unemployment Insurance (000s) | 02/23/08 | 02/16/08 | Y/Y | 2006 | 2005 | 2004 |
|---|---|---|---|---|---|---|
| Initial Claims | 373 | 354 | 10.7% | 313 | 331 | 343 |
| Continuing Claims | -- | 2,807 | 7.0% | 2,459 | 2,662 | 2,924 |
by Tom Moeller February 28, 2008
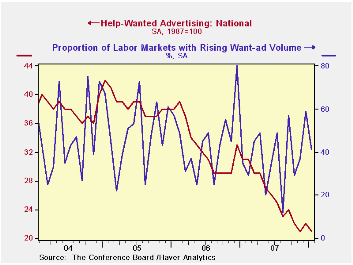
The Conference Board reported that its index of help-wanted advertising dipped last month to a reading of 21, the record low plumbed in November.
During the last ten years there has been a 57% correlation between the level of help-wanted advertising and the three month change in non-farm payrolls.
The proportion of labor markets with rising want-ads fell to 41% from 59% in December. Both figures were improved from the low of 12% in August.
Most regions of the country showed the same, depressed readings of help wanted as December except the East South Central region where the index declined.
The Conference Board surveys help-wanted print advertising volume in 51 major newspapers across the country every month. The latest help wanted report from the Conference Board is available here.In 2006, the Conference Board introduced its Help Wanted Online Data Series and the latest release can be found in this link.
| Conference Board | January | December | January 2007 | 2007 | 2006 | 2005 |
|---|---|---|---|---|---|---|
| National Help Wanted Index | 21 | 22 | 31 | 26 | 33 | 39 |
by Robert Brusca February 28, 2008
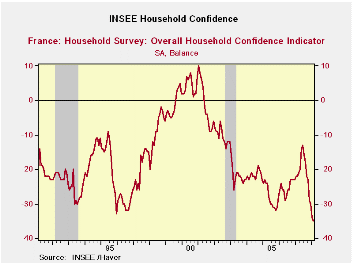 French household confidence is at an all time life-of-series
low. Living standards for the past 12 months are rated as the worst of
this 18-year period.Expected
conditions over the next 12 months are rated in the bottom 3 percent of
their range. Unemployment still is not widely expected and the
expectations reading stands in the 43rd
percentile of its range. Price developments are in the top of their 18
range when assessed over the past 12 months but only in their 40th
percentile looking forward. The environment for spending is weak, in
the 27th percentile of its historic range. And
the financial situation is sub par. The current financial situation is
rated at the 47th percentile of its range, a
moderate step below the midpoint (50). But the past 12 months are rated
in the bottom 9 percent of its range and the next 12 months are rated
in the bottom 7 percent of its range. Clearly consumers are having a
great difficulty and are unsure of the future and generally more
pessimistic.
French household confidence is at an all time life-of-series
low. Living standards for the past 12 months are rated as the worst of
this 18-year period.Expected
conditions over the next 12 months are rated in the bottom 3 percent of
their range. Unemployment still is not widely expected and the
expectations reading stands in the 43rd
percentile of its range. Price developments are in the top of their 18
range when assessed over the past 12 months but only in their 40th
percentile looking forward. The environment for spending is weak, in
the 27th percentile of its historic range. And
the financial situation is sub par. The current financial situation is
rated at the 47th percentile of its range, a
moderate step below the midpoint (50). But the past 12 months are rated
in the bottom 9 percent of its range and the next 12 months are rated
in the bottom 7 percent of its range. Clearly consumers are having a
great difficulty and are unsure of the future and generally more
pessimistic.
| INSEE Household Monthly Survey | ||||||||||
|---|---|---|---|---|---|---|---|---|---|---|
| Since Jan 1990 | Since Jan 1990 | |||||||||
| Feb 08 |
Jan 08 |
Dec 07 |
Nov 07 |
%tile | Rank | Max | Min | Range | Mean | |
| Household Confidence | -35 | -34 | -30 | -29 | 0.0 | 215 | 10 | -35 | 45 | -17 |
| Living Standards | ||||||||||
| past 12 Mos | -68 | -65 | -62 | -60 | 0.0 | 215 | 18 | -68 | 86 | -37 |
| Next 12-Mos | -42 | -44 | -32 | -36 | 3.4 | 212 | 15 | -44 | 59 | -18 |
| Unemployment: Next 12 | 11 | 9 | 6 | 13 | 43.6 | 160 | 73 | -37 | 110 | 29 |
| Price Developments | ||||||||||
| Past 12Mo | 41 | 37 | 40 | 31 | 100.0 | 1 | 41 | -57 | 98 | -19 |
| Next 12-Mos | -23 | -11 | -23 | -8 | 40.7 | 34 | 31 | -60 | 91 | -34 |
| Savings | ||||||||||
| Favorable to save | 24 | 28 | 29 | 26 | 55.6 | 100 | 40 | 4 | 36 | 23 |
| Ability to save Next 12 | -12 | -12 | -12 | -13 | 37.9 | 145 | 6 | -23 | 29 | -8 |
| Spending | ||||||||||
| Favorable for major purchase | -26 | -24 | -23 | -19 | 27.6 | 187 | 16 | -42 | 58 | -12 |
| Financial Situation | ||||||||||
| Current | 13 | 14 | 14 | 15 | 47.6 | 83 | 24 | 3 | 21 | 12 |
| Past 12 MOs | -25 | -25 | -23 | -20 | 9.1 | 203 | -5 | -27 | 22 | -16 |
| Next 12-Mos | -14 | -14 | -10 | -9 | 7.4 | 213 | 11 | -16 | 27 | 0 |
| Number of observations in the period: 218 | ||||||||||
by Robert Brusca February 28, 2008
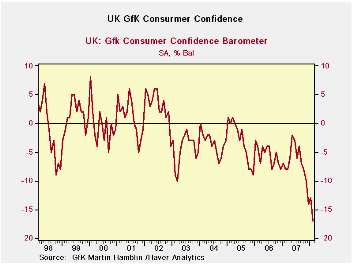 The UK economy has dropped and is dropping sharply in early
2008.The index is the
weakest it has been in at least 10 years. Over the past 12 months
households still rate their own financial situation in the top 80
percentile of its range the past 10
years. But they rate the time to make major purchases as the worst in
at least 10 years.The
general economic situation is called the worst in 10 years and the CPI
situation rates as the worst in 10 years.The
financial situation over the next 12 months is also rated as the worst
in the past 10 years. Income expectations are the lowest in 10 years
for lower as well as upper income earners.
The UK economy has dropped and is dropping sharply in early
2008.The index is the
weakest it has been in at least 10 years. Over the past 12 months
households still rate their own financial situation in the top 80
percentile of its range the past 10
years. But they rate the time to make major purchases as the worst in
at least 10 years.The
general economic situation is called the worst in 10 years and the CPI
situation rates as the worst in 10 years.The
financial situation over the next 12 months is also rated as the worst
in the past 10 years. Income expectations are the lowest in 10 years
for lower as well as upper income earners.
Like in France, the UK consumers are very disturbed by recent events. Both UK and French consumers rate prices as the worst in some time. Living standards have been eroded in both countries. Despite Europe’s continuing to grow there are obvious risks to the economy with consumers feeling so glum. We see it in recent reports in the US, in the UK, in France as well as in Japan.Consumer spending has lagged in Europe, in the US and in Japan and we see why, as consumers are forced to rate their own situation and that process tells us how bad they feel. Weak growth, financial turmoil, rising energy and food prices are taking a toll on consumers.
| GFK Consumer Survey | ||||||
|---|---|---|---|---|---|---|
| % of 2Yr | % of 10Yr | |||||
| Feb-08 | Jan-08 | Dec-07 | Nov-07 | Range | Range | |
| Consumer Confidence | -17 | -13 | -14 | -10 | 0.0% | 0.0% |
| Current | ||||||
| Household Fin Sit | 24 | 24 | 25 | 25 | 75.0% | 83.3% |
| Major Purchases | -19 | -13 | -14 | -7 | 0.0% | 0.0% |
| Last 12 Months | ||||||
| Household Fin Sit | -1 | 2 | -1 | 0 | 37.5% | 44.4% |
| General Econ Sit | -40 | -36 | -36 | -32 | 0.0% | 0.0% |
| CPI | 82 | 78 | 74 | 73 | 100.0% | 100.0% |
| Savings | 28 | 30 | 33 | 35 | 22.2% | 75.9% |
| Next 12-Months | ||||||
| Household Fin Sit | 6 | 7 | 8 | 9 | 0.0% | 0.0% |
| General Econ Sit | -29 | -26 | -26 | -21 | 0.0% | 16.7% |
| Unemployment | 32 | 29 | 30 | 31 | 50.0% | 70.8% |
| Major Purchases | -22 | -19 | -19 | -20 | 12.5% | 6.7% |
| Savings | 16 | 18 | 19 | 20 | 36.4% | 74.1% |
| By Income | ||||||
| Lower | -24 | -17 | -19 | -16 | 0.0% | 0.0% |
| Upper | -11 | -12 | -7 | -6 | 5.6% | 5.3% |
by Robert Brusca February 28, 2008
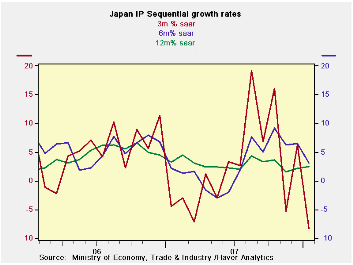
Japan’s dip in IP in January is hard to evaluate right now. IP trends are moving lower but the Yr/Yr rate is still steady. The shorter term sequential growth rates, in the table below, show that the recent weakness is an artifact of the 3-month growth rates alone. Six-month growth rates are higher that 12-month rates for Total MFG and total industry. But textiles output, investment goods and minting show erosion between the 6 and 12-month horizons. All sectors and industries see declines in January and all are lower over three months except electricity and gas producers.
| Japan Industrial Production Trends | |||||||
|---|---|---|---|---|---|---|---|
| m/m % | Saar % | Yr/Yr | |||||
| Jan-08 | Dec-07 | Nov-07 | 3-mo | 6-mo | 12-mo | Yr-Ago | |
| Mining & Mfg | -2.0% | 1.4% | -1.6% | -8.3% | 3.2% | 2.5% | 3.2% |
| Total Industry | -2.3% | 1.7% | -1.3% | -7.6% | 3.9% | 2.6% | 2.6% |
| Mfg | -1.9% | 1.4% | -1.6% | -8.3% | 3.4% | 2.5% | 3.2% |
| Textiles | -2.3% | 2.5% | -2.2% | -7.7% | -7.4% | -5.0% | -4.2% |
| Transport | -3.2% | 2.4% | -2.9% | -14.2% | 31.5% | 11.6% | 4.6% |
| Product Group | |||||||
| Consumer Goods | -1.5% | 2.1% | -2.1% | -6.1% | 13.2% | 4.2% | -0.8% |
| Intermediate Goods | -2.6% | 1.3% | -1.1% | -9.4% | 3.6% | 4.3% | 3.8% |
| Investment Goods | -0.4% | -0.6% | -1.9% | -11.1% | -7.6% | -3.4% | 5.8% |
| Mining | -2.9% | 1.1% | -5.9% | -27.2% | -15.9% | -5.1% | 3.5% |
| Electric & Gas | -1.4% | 0.2% | 2.0% | 3.2% | 15.2% | 5.9% | -2.8% |

Tom Moeller
AuthorMore in Author Profile »Prior to joining Haver Analytics in 2000, Mr. Moeller worked as the Economist at Chancellor Capital Management from 1985 to 1999. There, he developed comprehensive economic forecasts and interpreted economic data for equity and fixed income portfolio managers. Also at Chancellor, Mr. Moeller worked as an equity analyst and was responsible for researching and rating companies in the economically sensitive automobile and housing industries for investment in Chancellor’s equity portfolio. Prior to joining Chancellor, Mr. Moeller was an Economist at Citibank from 1979 to 1984. He also analyzed pricing behavior in the metals industry for the Council on Wage and Price Stability in Washington, D.C. In 1999, Mr. Moeller received the award for most accurate forecast from the Forecasters' Club of New York. From 1990 to 1992 he was President of the New York Association for Business Economists. Mr. Moeller earned an M.B.A. in Finance from Fordham University, where he graduated in 1987. He holds a Bachelor of Arts in Economics from George Washington University.
More Economy in Brief


