 Global| Dec 22 2004
US 3Q GDP Revised Up
by:Tom Moeller
|in:Economy in Brief
Summary
The "final" revision to US real GDP last quarter indicated 4.0% (AR) growth, up from the preliminary reading of 3.9% and the advance report of 3.7% growth. The Consensus expectation had been for no change at 3.9% growth. The decline [...]
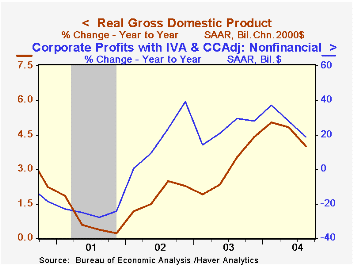
The "final" revision to US real GDP last quarter indicated 4.0% (AR) growth, up from the preliminary reading of 3.9% and the advance report of 3.7% growth. The Consensus expectation had been for no change at 3.9% growth.
The decline reported last month in corporate profits w/inventory (IVA) and capital consumption adjustments (CCAdj) was doubled to -4.8% (+5.8% y/y), the first quarterly decline since 1Q03. US nonfinancial corporate sector profits were little revised and rose 1.5% (18.8% y/y) but the decline in financial sector earnings was deepened to 19.8% (-17.0% y/y) from -13.4%.
Revisions to growth in domestic final demand were minimal. Personal consumption grew at a 5.1% (3.6% y/y) rate and business investment grew at a 13.0% rate (10.1% y/y). Residential investment grew at a 1.6% rate (8.0% y/y).
Slower accumulation of inventories subtracted slightly more than estimated earlier and twice the 0.5 percentage points estimated in the advance report and the drag from foreign trade was eased as import growth was lessened to 4.6% (11.1% y/y).
The estimate of price inflation was raised slightly to 1.4% (AR) as the PCE chain price index rose 1.3% (2.2% y/y) and the private fixed investment index rose 3.0% (3.0% y/y). A 5.1% gain in import prices held back the gain in GDP chain price index.
"Productivity Gains Showing Up in Services" from the Federal Reserve Bank of Dallas is available here.
| Chained 2000$, % AR | 3Q '04 (Final) | 3Q '04 (Prelim.) | 2Q '04 | Y/Y | 2003 | 2002 | 2001 |
|---|---|---|---|---|---|---|---|
| GDP | 4.0% | 3.9% | 3.3% | 4.0% | 3.0% | 1.9% | 0.8% |
| Inventory Effect | -1.0% | -0.9% | 0.8% | 0.4% | -0.1% | 0.5% | -0.8% |
| Final Sales | 5.0% | 4.9% | 2.5% | 3.6% | 3.1% | 1.4% | 1.6% |
| Trade Effect | -0.1% | -0.3% | -1.0% | -0.5% | -0.3% | -0.7% | -0.2% |
| Domestic Final Demand | 4.9% | 4.9% | 3.5% | 4.1% | 3.4% | 2.1% | 1.8% |
| Chained GDP Price Index | 1.4% | 1.3% | 3.2% | 2.3% | 1.8% | 1.7% | 2.4% |

Tom Moeller
AuthorMore in Author Profile »Prior to joining Haver Analytics in 2000, Mr. Moeller worked as the Economist at Chancellor Capital Management from 1985 to 1999. There, he developed comprehensive economic forecasts and interpreted economic data for equity and fixed income portfolio managers. Also at Chancellor, Mr. Moeller worked as an equity analyst and was responsible for researching and rating companies in the economically sensitive automobile and housing industries for investment in Chancellor’s equity portfolio. Prior to joining Chancellor, Mr. Moeller was an Economist at Citibank from 1979 to 1984. He also analyzed pricing behavior in the metals industry for the Council on Wage and Price Stability in Washington, D.C. In 1999, Mr. Moeller received the award for most accurate forecast from the Forecasters' Club of New York. From 1990 to 1992 he was President of the New York Association for Business Economists. Mr. Moeller earned an M.B.A. in Finance from Fordham University, where he graduated in 1987. He holds a Bachelor of Arts in Economics from George Washington University.
More Economy in Brief


