 Global| Sep 11 2009
University of Michigan SentimentMakes Surprising Jump
Summary
Consumer sentiment rose sharply to 70.2 in August in the U of M consumer sentiment preliminary report. The month’s rise in sentiment was the 42nd largest monthly rise out of the last 380 monthly changes. It was the fourth largest [...]
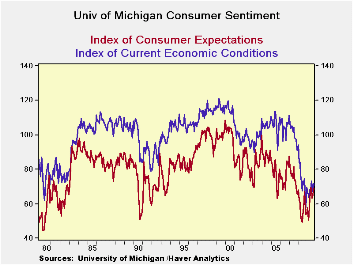
Consumer sentiment rose sharply to 70.2 in August in the U of
M consumer sentiment preliminary report. The month’s rise in sentiment
was the 42nd largest monthly rise out of the last 380 monthly changes.
It was the fourth largest monthly rise in the index in this
recession/recovery period. The current index rose sharply making the
second highest jump in this cycle. Expectations rose by 4.2 points
marking a solid rise that is the sixth largest gain for expectations in
this cycle. The move in August preliminary report is led by the
substantial gain in the current situation.
Still in terms of cycle levels the current situation is weak
standing at the 38Th percentile of its recession cycle range, while
expectations are just off their cycle peak reading of 70.8 (June 2009).
Both expectations and the current situation are some 30% shy
of their respective past cycle peaks. Still the day’s report represents
a sharp gain from the cycle lows and builds some well-needed momentum
into this report after a period of being mired below peak and sinking.
The consumer remains the key to this economic recovery since
there will be no investment of note until consumer spending picks up.
Exports which are doing well are simply too small to lead recovery.
Dropping imports are fools gold for growth since they only drop if
domestic demand is weak and that is the road to perdition not to crisis
contrition.
Near term we look, not inventory building, but to less cutting
to boost GDP growth. But that will not spur growth unless final sales
pick up requiring more restocking and spurring new rounds of hiring.
The consumer sentiment report may not dictate consumer spending
month-by-month. But the broad sweep of consumer moods do set the stage
for and reflect true changes in consumer spending habits.
In the month consumers have seen their personal finance
situation improve and the buying conditions are said to be the best in
three months and better than anything 15 months before that. It is an
important rise in this assessment. Importantly, expected business
conditions in the next 12 months are the best in 24 months.
This is a good solid report. As the back-to-school season
kicks in, the month of September is a key one for assessing how well
the economy is mending. So far it looks good.
| U of M Consumer Sentiment-Prelim | |||
|---|---|---|---|
| Sentiment | Current | Expectations | |
| Prelim | 70.2 | 71.8 | 69.2 |
| Last Month | 65.7 | 66.6 | 65.0 |
| Mo/Mo % | 6.8% | 7.8% | 6.5% |
| 2-Mos | 6.4% | 1.8% | 9.5% |
| Yr/Yr% | -0.1% | -4.3% | 3.0% |
| In Recession: Max,Min, Avg & Percentile | |||
| Max | 78.4 | 94.4 | 69.4 |
| Min | 55.3 | 57.5 | 49.2 |
| Average | 64.6 | 72.2 | 59.7 |
| Percentile | 64.5% | 38.8% | 99.0% |
| Cycle peak | 103.8 | 113.5 | 100.1 |
| % of Peak | 67.6 | 63.3 | 69.1 |
| U of M Consumer Sentiment-Prelim | |||
| Sentiment | Current | Expectations | |
| Max | 112.0 | 121.1 | 108.6 |
| Min | 51.7 | 57.5 | 44.2 |
| Average | 86.2 | 98.4 | 78.8 |
| Percentile | 30.7% | 22.5% | 38.8% |
| Rank % | 14.6% | 4.2% | 23.7% |
| Since January 1970 | |||
Export and Import Prices Pop But Ex-Oil Import Prices Barely Budge
by Robert Brusca September 11, 2009
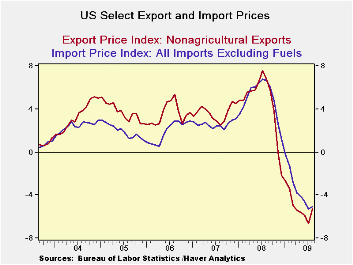
US export and import prices remained tame in August. Headline
prices shot up as oil prices scored double-digit gains in the month.
For exports the headline rise was spurred by industrial supplies and
the US does export some oil. Agricultural export prices were tame.
Export prices excluding agriculture rose by a sharp 0.8%. Import prices
excluding petroleum rose by 0.4% (after a 0.3% drop in July). The
headline price gains were more ominous-looking with an import prices up
by 2% and export prices gaining 0.7%
If you look up and down the export and import categories you
see tempered price trends with the exception of petroleum prices and
industrial supplies, the category that contains industrial supplies.
The US is not importing any inflation. This is just another
example of how weak the global economies still are. The dollar has been
weaker and oil prices have been rising but inflation is not getting any
traction.
| Export and Import Prices | |||||||
|---|---|---|---|---|---|---|---|
| M/MO | Saar | ||||||
| IMPORTS | Aug-09 | Jul-09 | Jun-09 | 3-MO | 6-MO | 12-MO | |
| ALL Imports | 2.0% | -0.7% | 2.7% | 17.5% | 15.8% | -15.0% | |
| Excl Petrol | 0.4% | -0.3% | 0.2% | 1.1% | -1.1% | -6.5% | |
| Petrol | 10.5% | -2.6% | 17.2% | 152.5% | 193.7% | -38.1% | |
| Foods Feeds and Beverages | 1.7% | -1.0% | 0.4% | 4.7% | 4.4% | -6.4% | |
| Industrial Supplies | 6.1% | -1.8% | 8.8% | 65.6% | 62.8% | -31.7% | |
| Capital goods | 0.1% | 0.0% | 0.0% | 0.4% | -0.6% | -1.5% | |
| Motor Vehicles & parts | 0.2% | 0.1% | 0.1% | 1.5% | 0.7% | 0.0% | |
| Consumer goods excl autos | -0.2% | -0.2% | 0.1% | -1.1% | -1.0% | -1.2% | |
| M/MO | Saar | ||||||
| EXPORTS | Aug-09 | Jul-09 | Jun-09 | 3-MO | 6-MO | 12-MO | |
| ALL Exports | 0.7% | -0.3% | 1.0% | 5.6% | 3.3% | -6.1% | |
| Agriculture | 0.2% | -4.9% | 4.2% | -2.7% | 6.1% | -14.1% | |
| Non Agriculture | 0.8% | 0.1% | 0.6% | 6.1% | 3.2% | -5.3% | |
| Food Feeds and Beverages | -0.1% | -5.6% | 4.4% | -5.6% | 3.5% | -13.0% | |
| Industrial Supplies | 2.3% | 0.0% | 2.0% | 18.3% | 8.4% | -17.5% | |
| Capital Goods | 0.1% | 0.3% | 0.1% | 2.0% | 2.4% | 1.6% | |
| Motor Vehicles & Parts | 0.1% | -0.2% | -0.1% | -0.7% | -0.4% | 0.1% | |
| Consumer goods excl autos | 0.3% | 0.4% | 0.4% | 4.1% | -0.5% | 0.0% | |
UK Producer Prices Showing Steady Accelerating Rise From Lows
by Robert Brusca September 11, 2009
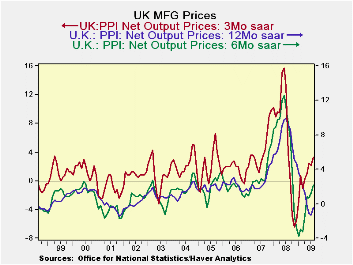
Manufacturing prices in the UK rose by 0.5% in August as core
prices rose by 0.4%. Over 12- to 6- to 3-months annualized rates of MFG
prices are accelerating. But over the same periods Core MFG prices look
more as if they are decelerating.
The chart shows the clear upward path of overall price
inflation in the UK. It certainly has a lot to do with the ongoing
rebound in global oil prices. Yet, Yr/Yr overall MFG prices are still
falling. And Yr/Yr core prices are up by just 0.7%. While the charts
dramatize the turnaround in inflation trends don’t forget to look at
the scales. Inflation is rising from deeply negative numbers to modest
rates of increase even when compounded over short periods. Yr-over-year
headline inflation is still lower. The modest core further cements the
notion of inflation being controlled. For now the pressure is mostly
due to oil prices and the pace of price recovery should not be taken
out of its proper context.
| UK PPI MFG net output prices | |||||||
|---|---|---|---|---|---|---|---|
| %m/m | %-SAAR | ||||||
| Aug-09 | Jul-09 | Jun-09 | 3-mo | 6-mo | 12-mo | 12-moY-Ago | |
| MFG | 0.5% | 0.2% | 0.1% | 3.2% | 2.1% | -0.4% | 9.2% |
| Core | 0.4% | 0.4% | -0.6% | 0.4% | 1.1% | 0.7% | 5.7% |
| Core: ex food beverages, tobacco & Petroleum | |||||||

Robert Brusca
AuthorMore in Author Profile »Robert A. Brusca is Chief Economist of Fact and Opinion Economics, a consulting firm he founded in Manhattan. He has been an economist on Wall Street for over 25 years. He has visited central banking and large institutional clients in over 30 countries in his career as an economist. Mr. Brusca was a Divisional Research Chief at the Federal Reserve Bank of NY (Chief of the International Financial markets Division), a Fed Watcher at Irving Trust and Chief Economist at Nikko Securities International. He is widely quoted and appears in various media. Mr. Brusca holds an MA and Ph.D. in economics from Michigan State University and a BA in Economics from the University of Michigan. His research pursues his strong interests in non aligned policy economics as well as international economics. FAO Economics’ research targets investors to assist them in making better investment decisions in stocks, bonds and in a variety of international assets. The company does not manage money and has no conflicts in giving economic advice.
More Economy in Brief


