 Global| Sep 12 2011
U.S. Wholesale Sales Are Flat Though Inventories Gain
by:Tom Moeller
|in:Economy in Brief
Summary
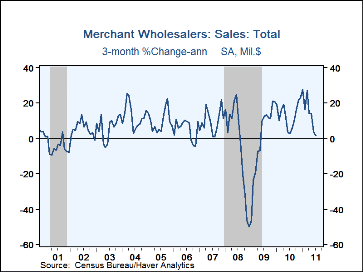
On Friday, the Commerce Department reported that sales in the wholesale sector were essentially unchanged during July after a 0.6% jump in June. A 0.8% increase had been generally expected. Holding back the increase was a 1.1% decline [...]
 On Friday, the Commerce Department reported that sales in the wholesale sector were
essentially unchanged during July after a 0.6% jump in June. A 0.8%
increase had been generally expected. Holding back the increase was a 1.1%
decline (+16.7% y/y) in sales of nondurables. Sales of petroleum &
products fell 1.5% but still were up by one-third y/y with higher
prices. Sales of paper fell 1.2% (-0.5% y/y) and sales of apparel slipped
0.6% (-0.2% y/y). However, sales of chemicals rose 0.6% (14.5% y/y). In
the durables sector, sales were strong due to a 5.3% jump (9.4% y/y) in
motor vehicles. Furniture sales also rose a firm 3.3% (7.0% y/y) and
machinery rose 1.7% (19.0% y/y). However, these increases were offset by
lower sales of electrical equipment (+5.0% y/y) and of hardware, plumbing
and heating equipment (+5.1% y/y).
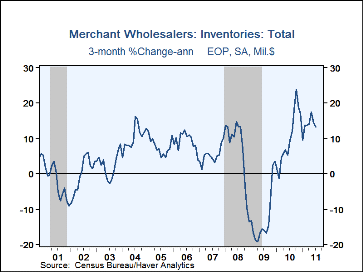
Inventories at the wholesale level posted a firm 0.8% gain, though they had been rising in excess of 1.0% m/m earlier this year. Strength in petroleum prices lifted product inventories by one-third y/y. Elsewhere amongst nondurables, apparel inventories rose 2.9% and by nearly one-third y/y while chemical inventories jumped 2.3% (18.1% y/y). Paper inventories rose 0.6% (7.0% y/y). Amongst durable goods, inventories of autos rose 0.6% (14.3% y/y) but furniture slipped 0.7% (+5.2% y/y). Electrical equipment inventories increased 10.0% y/y and machinery rose 9.9%.
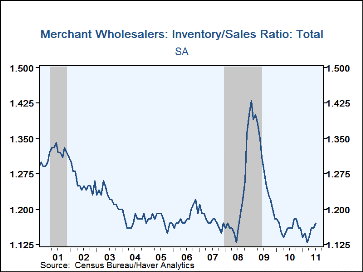
The wholesale sector's inventory-to-sales ratio ticked up again to 1.17, its highest level in nine months. The increase was led by a surge in the apparel sector's ratio to its highest since 1996 (no typo). The paper industry's ratio also surged as did the ratio in the chemical industry. In the durables sector, the ratio held comparatively low except for a surge in computer equipment.
The wholesale trade figures are available in Haver's USECON database. The expectation figure is in AS1REPNA.
| Wholesale Sector - NAICS Classification (%) | Jul | Jun | May | Y/Y | 2010 | 2009 | 2008 |
|---|---|---|---|---|---|---|---|
| Sales | -0.0 | 0.6 | -0.3 | 14.4 | 12.6 | -16.1 | 5.9 |
| Inventories | 0.8 | 0.6 | 1.7 | 15.1 | 11.0 | -11.8 | 3.7 |
| I/S Ratio | 1.17 | 1.16 | 1.16 | 1.16 | 1.16 | 1.30 | 1.21 |
Tom Moeller
AuthorMore in Author Profile »Prior to joining Haver Analytics in 2000, Mr. Moeller worked as the Economist at Chancellor Capital Management from 1985 to 1999. There, he developed comprehensive economic forecasts and interpreted economic data for equity and fixed income portfolio managers. Also at Chancellor, Mr. Moeller worked as an equity analyst and was responsible for researching and rating companies in the economically sensitive automobile and housing industries for investment in Chancellor’s equity portfolio. Prior to joining Chancellor, Mr. Moeller was an Economist at Citibank from 1979 to 1984. He also analyzed pricing behavior in the metals industry for the Council on Wage and Price Stability in Washington, D.C. In 1999, Mr. Moeller received the award for most accurate forecast from the Forecasters' Club of New York. From 1990 to 1992 he was President of the New York Association for Business Economists. Mr. Moeller earned an M.B.A. in Finance from Fordham University, where he graduated in 1987. He holds a Bachelor of Arts in Economics from George Washington University.


