 Global| Dec 24 2008
U.S. Weekly Claims For Jobless Insurance Double From Last Year's Lows
by:Tom Moeller
|in:Economy in Brief
Summary
Initial claims for unemployment insurance rose sharply last week and the 30,000 increase to 586,000 pushed them to a level nearly double the lows of last year.Expectations had been for stability in claims last week at 551,000. The [...]
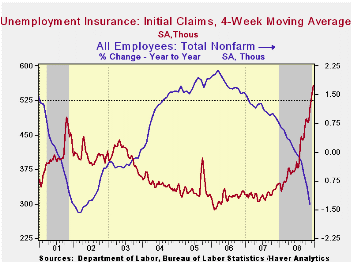
Initial claims for unemployment insurance rose sharply last week and the 30,000 increase to 586,000 pushed them to a level nearly double the lows of last year.Expectations had been for stability in claims last week at 551,000. The rise in the trend level of claims is reinforced by the gain in the four-week moving average of initial claims to a cycle high of 558,000, up 61.9% y/y.
The rise in initial claims has been accompanied by a 1.4%
decline in nonfarm payrolls since year-end 2007.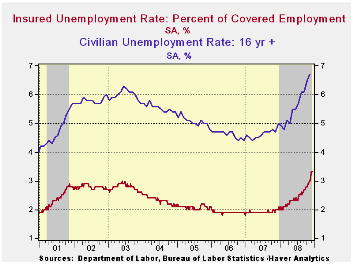
The Labor Department indicated that the largest increases in initial claims for the week ending December 13 were in Oklahoma (+1,590), Connecticut (+1,286), Illinois (+962), Maine (+707), and Utah (+402), while the largest decreases were in North Carolina (-20,526), California (-16,493), Pennsylvania (-12,438), Georgia (-12,053), and South Carolina (-8,432).
Continuing claims for unemployment insurance during the week of December 13 fell 17,000 after a revised 44,000 decline during the prior week. But again the trend is up sharply. As a result of a huge 340,000 increase at the end of November, continuing claims were still near their highest level since 1982. The four-week average of continuing claims rose to 4,319,750. Continuing claims provide some indication of workers' ability to find employment and they lag the initial claims figures by one week.
The insured rate of unemployment held for the third consecutive week at this cycle's high of 3.3%.
The highest insured unemployment rates in the week ending December 6 were in Oregon (5.2 percent), Puerto Rico (5.2), Michigan (4.9), Idaho (4.7), Pennsylvania (4.7), Nevada (4.6), Wisconsin (4.3), South Carolina (4.2), California (4.1), Alaska (4.0), Arkansas (4.0), and New Jersey (4.0).
On Economic Conditions and Building a Recovery is the recent speech given by Dennis P. Lockhart, President and Chief Executive Officer of the Federal Reserve Bank of Atlanta and it can be found here.
| Unemployment Insurance (000s) | 12/20/08 | 12/13/08 | 12/06/08 | Y/Y | 2007 | 2006 | 2005 |
|---|---|---|---|---|---|---|---|
| Initial Claims | 586 | 556 | 575 | 66.0% | 322 | 313 | 331 |
| Continuing Claims | -- | 4,370 | 4,387 | 61.7% | 2,552 | 2,459 | 2,662 |
by Tom Moeller December 24, 2008
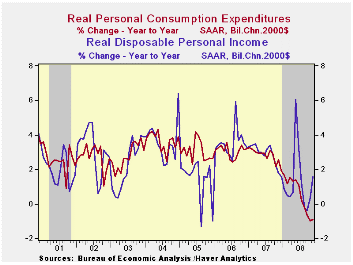
Consumers further retrenched last month as spending was cut in a successful attempt to raise savings. Personal consumption expenditures fell 0.6% during November after an unrevised 1.0% October decline. The latest was the fifth consecutive monthly drop which pulled the y/y rise to a barely positive 0.5%, the weakest since 1961.
So far in 4Q, spending is down at a 6.2% annual rate from 3Q, but the drop in gasoline prices is helping to lift real spending. It gained 0.6% during November and that was the first rise since May. So far in 4Q, real spending is down at a 2.2% annual rate from 3Q. That compares to a 3.8% decline during 3Q. During the last three months together, real spending on motor vehicles fell at a 50.3% annual rate. Furniture spending rose at a 3.7% rate due to price deflation stimulating sales. Lower prices only somewhat helped spending on clothing. Real spending here fell at a 0.8% rate during the last three months, following their summer collapse, while nominal spending continued to fall sharply at a 5.0% rate during those three months.
Lower gasoline prices have fueled more driving. Since a year
ago gasoline prices have halved and they're down at an 86% annual rate
during the last three months. As a result, nominal spending on gasoline
& oil is down at an 81% annual rate during the last three
months. But real spending is up at a 40% rate. The level of
real spending on gasoline is near its historic high.
Disposable personal income fell 0.1% last month following a downwardly revised 0.2% October increase. Again, lower prices have bolstered real income. Adjusted for inflation disposable income rose 1.0% after a 0.7% October increase. That raised the level of real take home income pay by 1.6% versus a year ago and by 3.5% so far in 4Q versus 3Q.
Overall, personal income fell 0.2% last month versus
expectations for no change. October's income gain was revised down.
Wage & salary income slipped 0.1% and that reversed an
unrevised 0.1% uptick during October. The y/y gain of 1.5% compares to
a 5.6% rise last year. Factory sector wages fell for the fourth
straight month (-2.4% y/y) and wages & salaries in the private
service-providing industries slipped 0.1%. The 1.4% y/y rise compares
to 6% or greater growth from 2004 to 2007. Wages in the government
sector rose 0.3% and year-to-year growth of 5.5% has been steady.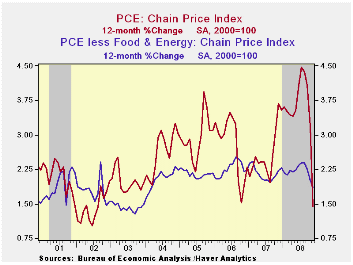
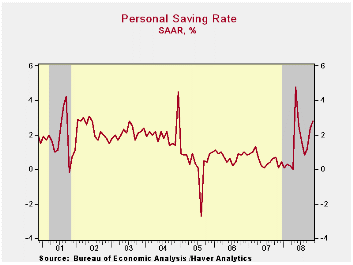
Reduced spending combined with modest income growth raised the personal savings rate to 2.8%. So far this year, the savings rate has averaged 1.5%, the highest since 2004.
The PCE chain price index fell 1.1% and the index was slightly below its May level. Lower gasoline prices, off 28.5% (-27.9% y/y), again offset the rise in food prices which rose 0.3% (6.2% y/y). The core PCE price index fell slightly for the second month and the decline matched Consensus expectations. Three-month growth of 0.5% was the lowest since 2001. Furniture prices fell yet again (-3.6% y/y) while apparel prices fell 0.3% y/y. Transportation costs continued firm and rose 5.4% y/y while medical care prices rose 2.0% y/y.
The figures noted above are available in the Haver USECON
and in the USNA databases.
| Disposition of Personal Income (%) | November | October | Y/Y | 2007 | 2006 | 2005 |
|---|---|---|---|---|---|---|
| Personal Income | -0.2 | 0.1 | 2.5 | 6.1 | 7.1 | 5.6 |
| Disposable Personal Income | -0.1 | 0.2 | 3.0 | 5.5 | 6.4 | 4.4 |
| Personal Consumption | -0.6 | -1.0 | 0.5 | 5.5 | 5.9 | 6.2 |
| Saving Rate | 2.8 | 2.4 | 0.1 (Nov. '07) | 0.5 | 0.7 | 0.3 |
| PCE Chain Price Index | -1.1 | -0.5 | 1.4 | 2.6 | 2.8 | 2.9 |
| Less food & energy | -0.0 | -0.0 | 1.9 | 2.2 | 2.3 | 2.1 |

Tom Moeller
AuthorMore in Author Profile »Prior to joining Haver Analytics in 2000, Mr. Moeller worked as the Economist at Chancellor Capital Management from 1985 to 1999. There, he developed comprehensive economic forecasts and interpreted economic data for equity and fixed income portfolio managers. Also at Chancellor, Mr. Moeller worked as an equity analyst and was responsible for researching and rating companies in the economically sensitive automobile and housing industries for investment in Chancellor’s equity portfolio. Prior to joining Chancellor, Mr. Moeller was an Economist at Citibank from 1979 to 1984. He also analyzed pricing behavior in the metals industry for the Council on Wage and Price Stability in Washington, D.C. In 1999, Mr. Moeller received the award for most accurate forecast from the Forecasters' Club of New York. From 1990 to 1992 he was President of the New York Association for Business Economists. Mr. Moeller earned an M.B.A. in Finance from Fordham University, where he graduated in 1987. He holds a Bachelor of Arts in Economics from George Washington University.
More Economy in Brief


