 Global| Nov 09 2006
U.S. Trade Deficit Narrowed Sharply
by:Tom Moeller
|in:Economy in Brief
Summary
Lower oil prices in September caused the U.S. foreign trade to reverse the prior month's run up and fall to $64.3B. The record August deficit was revised shallower to $69.0B. The latest figure also was shallower than Consensus [...]
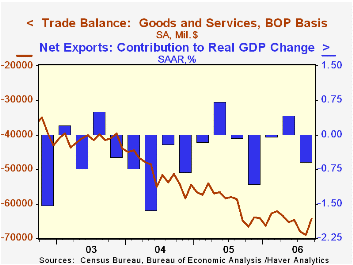
Lower oil prices in September caused the U.S. foreign trade to reverse the prior month's run up and fall to $64.3B. The record August deficit was revised shallower to $69.0B. The latest figure also was shallower than Consensus expectations for a deficit of $66.0B.
Imports of petroleum products fell 10.5% (+10.4% y/y) as the per barrel price of crude oil fell 5.4% to $62.52 and the quantity of crude imported per day fell 4.8% (+14.0% y/y). The price of oil in October fell another five dollars per barrel.
Overall September imports of goods & services fell 2.1% m/m and fully reversed the August gain. Imports of nonpetroleum products, however, fell only 0.7% (+9.6% y/y) after a 2.5% August rise. Imports of capital goods fell just 1.5% (10.9% y/y) after two months of gain exceeding 2% and nonauto consumer goods imports rose 1.5% (11.2% y/y), the same as during August. Automotive imports fell 1.9% (+4.1% y/y) while imports of crude materials less fuels fell 8.1% (NSA, +12.1% y/y).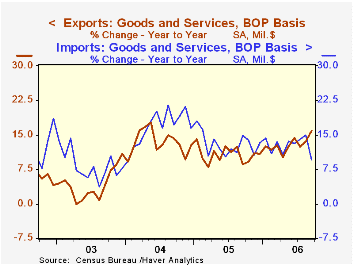
Total exports added 0.5% to the firm 2.4% August gain as capital goods exports jumped another 2.0% (22.1% y/y). Exports of civilian aircraft surged by more than one third (308.2% y/y) but computer exports fell (+6.5% y/y). Exports of telecommunications equipment rose 2.3% (15.5% y/y) while exports of nonauto consumer goods fell 3.2% (+9.0% y/y) after several months of strong gain.
Service exports slipped 0.1% (+6.5% y/y) as travel exports fell 0.9% (+2.5% y/y) and passenger fares dipped 0.5% (-2.3% y/y). Imports of services ticked up 0.2% (7.9% y/y) though passenger fares fell 1.3% (-0.9% y/y).
The U.S. trade deficit in goods with China deepened to another record $23.0B in September ($201.5B in 2005) as exports fell 2.7% (+44.5% y/y) but imports rose 3.3% (18.5% y/y). With the newly industrialized Asian countries, the balance of goods trade narrowed sharply m/m to a deficit of $0.7B (-$15.8B in 2005) as exports rose 3.8% (+22.5% y/y) and imports fell 6.8% (+8.2% y/y).
Twin Deficits, Twenty Years Later from the Federal Reserve Bank of New York is available here.
| Foreign Trade | September | August | Y/Y | 2005 | 2004 | 2003 |
|---|---|---|---|---|---|---|
| U.S. Trade Deficit | $64.3B | $69.0B | $65.0B (9/05) |
$716.7B | $611.3B | $494.9B |
| Exports - Goods & Services | 0.5% | 2.4% | 15.8% | 10.7% | 13.4% | 4.2% |
| Imports - Goods & Services | -2.1% | 2.0% | 9.4% | 13.0% | 16.7% | 8.3% |

Tom Moeller
AuthorMore in Author Profile »Prior to joining Haver Analytics in 2000, Mr. Moeller worked as the Economist at Chancellor Capital Management from 1985 to 1999. There, he developed comprehensive economic forecasts and interpreted economic data for equity and fixed income portfolio managers. Also at Chancellor, Mr. Moeller worked as an equity analyst and was responsible for researching and rating companies in the economically sensitive automobile and housing industries for investment in Chancellor’s equity portfolio. Prior to joining Chancellor, Mr. Moeller was an Economist at Citibank from 1979 to 1984. He also analyzed pricing behavior in the metals industry for the Council on Wage and Price Stability in Washington, D.C. In 1999, Mr. Moeller received the award for most accurate forecast from the Forecasters' Club of New York. From 1990 to 1992 he was President of the New York Association for Business Economists. Mr. Moeller earned an M.B.A. in Finance from Fordham University, where he graduated in 1987. He holds a Bachelor of Arts in Economics from George Washington University.
More Economy in Brief


