 Global| Apr 12 2006
U.S. Trade Deficit Down
by:Tom Moeller
|in:Economy in Brief
Summary
During February, the U.S. foreign trade deficit reversed most of the prior month's unrevised surge and fell to $65.7B. The decline exceeded Consensus expectations for a deficit of $67.5B. A 2.3% decline in imports during February was [...]
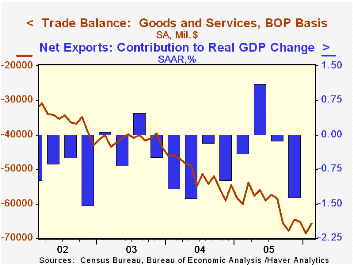
During February, the U.S. foreign trade deficit reversed most of the prior month's unrevised surge and fell to $65.7B. The decline exceeded Consensus expectations for a deficit of $67.5B.
A 2.3% decline in imports during February was led by a 3.6% fall (+7.3% y/y) in nonpetroleum imports which reversed the prior month's jump. Imports of capital goods fell 4.4% (+9.1% y/y) due to a huge 23.7% drop in civilian aircraft (+10.1% y/y). Imports of advanced technology products fell 8.5% (NSA, +8.4% y/y).Nonauto consumer goods also reversed the prior month's gain with a 2.5% decline (-0.4% y/y) due to lower imports of furniture & appliances.
Petroleum imports rose 0.2% (38.8% y/y) but in constant dollars they were 0.6% (-2.6% y/y) lower. The quantity of crude oil imports fell 3.9% (-2.0% y/y) and all energy-related petroleum product imports fell 8.9% (-2.9% y/y). Crude oil prices rose 3.4% (45.8% y/y) to an average $53.72 per bbl.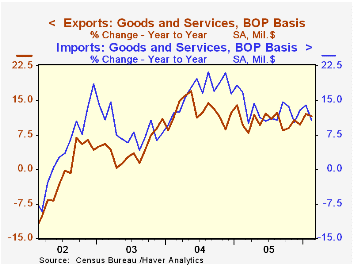
Total exports gave back roughly half of the prior month's strong gain with a 1.2% drop led by a by a 0.8% decline in exports of nonauto consumer goods (+9.5% y/y) which was the second consecutive m/m drop. Capital goods exports also fell by 0.8% (+17.6% y/y) though that followed a 2.9% January jump while exports of advanced technology products rose 0.7% (NSA, +24.0% y/y).
The US trade deficit with China narrowed sharply to $13.9B ($201.6B for 2005) as exports jumped (32.6% y/y). The trade deficit with Japan deepened to $7.1B ($82.7B in 2005) as exports rose 10.1% y/y. The trade deficit with the Asian NICs halved versus January to $1.1B ($15.9B in 2005) and a 4.7% y/y rise in exports outpaced the 3.5% increase in imports. The deficit with the European Union narrowed for the fourth consecutive month and stood at $8.3B ($122.4B in 2005).
External Imbalances and Adjustment in the Pacific Basin: Conference Summary from the Federal Reserve Bank of San Francisco can be found here.
| Foreign Trade | Feb | Jan | Y/Y | 2005 | 2004 | 2003 |
|---|---|---|---|---|---|---|
| Trade Deficit | $65.7B | $68.6B | $60.1B (2/05) | $723.6B | $617.6B | $494.8B |
| Exports - Goods & Services | -1.2% | 2.5% | 11.5% | 10.5% | 12.6% | 4.6% |
| Imports - Goods & Services | -2.3% | 3.6% | 10.7% | 12.8% | 16.6% | 8.5% |

Tom Moeller
AuthorMore in Author Profile »Prior to joining Haver Analytics in 2000, Mr. Moeller worked as the Economist at Chancellor Capital Management from 1985 to 1999. There, he developed comprehensive economic forecasts and interpreted economic data for equity and fixed income portfolio managers. Also at Chancellor, Mr. Moeller worked as an equity analyst and was responsible for researching and rating companies in the economically sensitive automobile and housing industries for investment in Chancellor’s equity portfolio. Prior to joining Chancellor, Mr. Moeller was an Economist at Citibank from 1979 to 1984. He also analyzed pricing behavior in the metals industry for the Council on Wage and Price Stability in Washington, D.C. In 1999, Mr. Moeller received the award for most accurate forecast from the Forecasters' Club of New York. From 1990 to 1992 he was President of the New York Association for Business Economists. Mr. Moeller earned an M.B.A. in Finance from Fordham University, where he graduated in 1987. He holds a Bachelor of Arts in Economics from George Washington University.


