Global| Jan 30 2009
U.S. Recession Intensifies; 3.8%Drop in Real GDP Is Sharpest Since 1982
by:Tom Moeller
|in:Economy in Brief
Summary
The current recession in economic activity intensified last quarter. Real GDP contracted at a 3.8% annual rate. Although, the rate of decline was less than the generally expected 5.4%, it was the deepest quarterly drop since the last, [...]
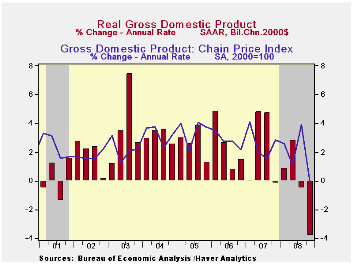
The current recession in economic activity intensified last quarter. Real GDP contracted at a 3.8% annual rate. Although, the rate of decline was less than the generally expected 5.4%, it was the deepest quarterly drop since the last, sharp recession of 1982. Moreover, a run-up in inventories accounted for the upside surprise to growth and that will have limited staying power if demand remains under pressure.
Real U.S. final sales to domestic purchasers contracted at a 4.9% annual rate after the 2.2% 3Q drop. That was the worst decline since the notably sharp, "credit crunch" recession of 1980 when consumers pocketed their credit cards. Personal consumption expenditures fell a sharp 3.5% (AR) after a like decline during 3Q. Business fixed investment fell off a cliff at a 19.1% annual rate. Residential investment fell at a 23.6% rate. Combined, business plus residential investment declined for the tenth quarter out of the last eleven.
The sharpness of that decline in demand suggests that the
strong rate of 4Q inventory accumulation was involuntary. Inventory
accumulation added 1.3 percentage points to GDP growth which was the
most for one quarter since 2005. The increase then was followed by
three consecutive quarters of decumulation or modest accumulation as
tight control methods kept inventories under wraps.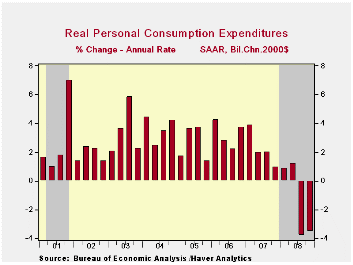
An improved foreign trade deficit added just 0.1 percentage points to 4Q GDP growth, held down by an outsized 19.8% decline in exports. Imports fell at a 15.7% rate with the developing domestic recession.
The estimate of the GDP chain price index fell by 0.1% (AR), the first quarterly decline since 1954. It was a give-back from the a strong 3.9% gain during 3Q. The 4Q drop was led by lower oil prices which pulled down the PCE deflator at a 5.5% annual rate, reversing all of the 3Q increase. The residential investment chain price index fell at an 8.2% annual rate but the business fixed investment price index rose 5.0%, about as it did during 3Q.
| Chained 2000$, % AR | 4Q '08 (Advance) | 3Q '08 | 4Q Y/Y | 2008 | 2007 | 2006 |
|---|---|---|---|---|---|---|
| GDP | -3.8 | -0.5 | -0.2 | 1.3 | 2.0 | 2.8 |
| Inventory Effect | 1.3 | 0.8 | 0.1 | 0.1 | -0.4 | 0.0 |
| Final Sales | -5.1 | -1.3 | -0.3 | 1.4 | 2.4 | 2.8 |
| Foreign Trade Effect | 0.1 | 1.1 | 1.4 | 1.4 | 0.6 | 0.2 |
| Domestic Final Demand | -4.9 | -2.2 | -1.5 | 0.0 | 1.8 | 2.6 |
| Chained GDP Price Index | -0.1 | 3.9 | 1.9 | 2.2 | 2.7 | 3.2 |
U.S. Employment Cost Index Increase Eased Slightly During 4Q; 2008 Gain A Record Low
by Tom Moeller January 30, 2009
Weak job markets have held down compensation. For private
industry workers, the employment cost index increased by 0.5% during
4Q. The rise eased slightly from the 0.6% 3Q increase and it left costs
up 2.9% for the full year. That was down slightly from the 3.1% rise
during 2007 and the quarterly gain fell short of Consensus expectations
for a 0.7% rise. A notion of weakness in compensation growth
was emphasized by the 4Q-to-4Q rate of increase of 2.4%. That was the
weakest in the series' history which extends back to 1980.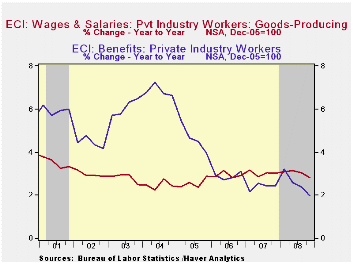
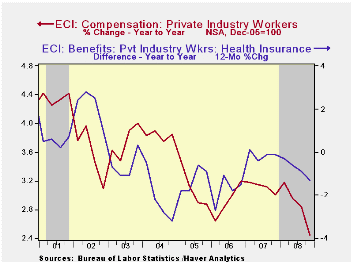
The rise in benefit costs was the main cause of the slowdown in overall compensation costs. The quarterly increase slowed to 0.2%, the weakest since early last year. The 2.0% year-to-year rise was near the slowest since 1999. In the goods producing sector benefits ticked up 0.1% (1.5% y/y) and in services they nudged up just 0.2% (2.2% y/y) after a 0.6% 3Q gain.
Health benefit costs rose 3.5% y/y and that was the slowest rate of growth since 1998.
Wage and salary growth of 0.3% was half the rate of increase during 3Q. Wages account for roughly 70% of the compensation index. The 4Q-to-4Q gain of 2.6% clearly was restrained by the weak job market and it was the weakest increase since 2006. Wages in the services industries grew a modest 0.3% and the y/y gain of 2.6% also was the weakest since 2006. Wages in the goods producing industries rose 0.4% (2.8% y/y) and that y/y growth compares to a recent peak of 4.0% in 2000.
| ECI - Private Industry Workers (%) | 4Q '08 | 3Q '08 | 4Q Y/Y | 2008 | 2007 | 2006 |
|---|---|---|---|---|---|---|
| Compensation | 0.5 | 0.6 | 2.4 | 2.9 | 3.1 | 2.9 |
| Wages & Salaries | 0.3 | 0.6 | 2.6 | 3.0 | 3.4 | 2.9 |
| Benefit Costs | 0.2 | 0.5 | 2.0 | 2.5 | 2.4 | 2.9 |
Michigan Consumer Sentiment Up Slightly In January, Yet Still Near Series' Low
by Tom Moeller January 30, 2009
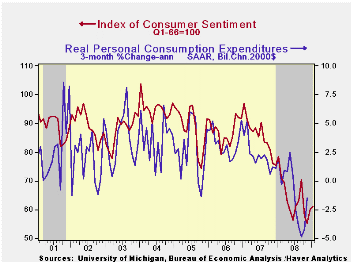
The January consumer sentiment index from the University of Michigan rose slightly for the second month. The 1.8% rise was slightly less than indicated in the mid-month report but it followed an 8.7% increase off the cycle's low in December. Nevertheless, at 61.2, the latest level was close to the lows for the series which occurred in the severe recessions of 1973-75 and 1980. Moreover, the figure remained down nearly one-quarter from last year. The latest reading about matched Consensus expectations for a reading of 61.9.
During the last ten years there has been a 58% correlation between the level of sentiment and the three-month change in real consumer spending.
The expectations component of consumer sentiment rose
moderately. Still, the series was near its lowest since 1990 and close
to the low of 1980. Expectations for business conditions during the
next year rose somewhat and expectations for conditions during the next
five years also ticked up. The expected change in personal finances
rose to the highest level since September.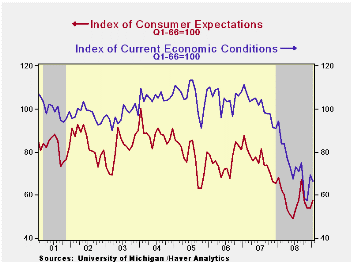
The current economic conditions index fell after an initial reading that was unchanged from December. The buying conditions index for large household goods fell sharply but the view of current personal finances rose (surprisingly) to the highest level since September. The figure did, however, remain off sharply from the 2007 average.
The opinion of government policy, which apparently influences economic expectations, was about unchanged but off a sharp 28.2% during the last twelve months. Only seven percent of respondents thought that a good job was being done by government and a near-record fifty-one percent thought that a poor job was being done.
Inflation expectations ticked slightly higher to 2.5% during the next year but that remained near the series' low. It was as high as 7.0% in May. The expected inflation rate during the next five years rose off the series' low to 3.7%.
The University of Michigan survey is not seasonally adjusted.The reading is based on telephone interviews with about 500 households at month-end; the mid-month results are based on about 300 interviews. The summary indexes are in Haver's USECON database, with details in the proprietary UMSCA database.
| University of Michigan | January | December | November | January y/y | 2008 | 2007 | 2006 |
|---|---|---|---|---|---|---|---|
| Consumer Sentiment | 61.2 | 60.1 | 55.3 | -21.9% | 63.8 | 85.6 | 87.3 |
| Current Conditions | 66.5 | 69.5 | 57.5 | -29.6 | 73.7 | 101.2 | 105.1 |
| Expectations | 57.8 | 54.0 | 53.9 | -15.1 | 57.3 | 75.6 | 75.9 |
by Robert Brusca January 30, 2009
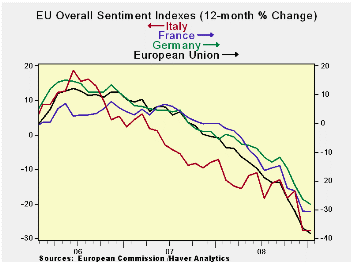
The EU sentiment index has fallen to a record low. Most of its sector readings are on lows as well. Construction, in the lower 13% of its range, is the strongest sector in relative terms. The sentiment indices for the major EMU nations and for the UK are on lows as well – at the very bottom of their ranges. France is the relative strongest in only the bottom 5% of its range. Europe is obviously getting clobbered and the weakness runs across sectors and countries. The EMU overall sentiment reading fell to 64.9 in Jan from 68.2 in December – a very sharp fall at a reading level that is already so low. That is not a good sign. The pace of the drop in sentiment is not slowing down.
| EU Sectors and Country level Overall Sentiment | R-SQ | ||||||||||
|---|---|---|---|---|---|---|---|---|---|---|---|
| EU | Jan 09 |
Dec 08 |
Nov 08 |
Oct 08 |
%tile | Rank | Max | Min | Range | Mean | w/ Overall |
| Overall | 64.9 | 68.2 | 75.1 | 81.1 | 0.0 | 220 | 116 | 65 | 51 | 100 | 1.00 |
| Industrial | -34 | -32 | -25 | -19 | 0.0 | 220 | 7 | -34 | 41 | -8 | 0.85 |
| Consumer Confid | -31 | -28 | -24 | -23 | 0.0 | 220 | 2 | -31 | 33 | -11 | 0.87 |
| Retail | -25 | -25 | -18 | -16 | 0.0 | 219 | 6 | -25 | 31 | -6 | 0.61 |
| Construction | -36 | -32 | -28 | -25 | 13.3 | 203 | 3 | -42 | 45 | -17 | 0.48 |
| Services | -28 | -23 | -18 | -10 | 0.0 | 145 | 33 | -28 | 61 | 15 | 0.82 |
| %m/m | Jan 09 |
Based on Level | Level | ||||||||
| EMU | -2.1% | -10.2% | -5.7% | 68.9 | 0.0 | 220 | 118 | 69 | 49 | 99 | 0.96 |
| Germany | -4.0% | -6.4% | -7.0% | 74.4 | 0.0 | 220 | 121 | 74 | 46 | 99 | 0.61 |
| France | -1.2% | -10.6% | -1.8% | 74.4 | 5.2 | 219 | 119 | 72 | 47 | 100 | 0.81 |
| Italy | -1.4% | -11.7% | -1.4% | 71.9 | 0.0 | 220 | 121 | 72 | 50 | 100 | 0.79 |
| Spain | 3.7% | -7.2% | -3.4% | 69.2 | 5.0 | 219 | 117 | 67 | 50 | 100 | 0.69 |
| Memo:UK | -10.9% | -0.6% | -9.9% | 60.2 | 0.0 | 220 | 117 | 60 | 57 | 100 | 0.50 |
| Since 1990 except Services (Oct 1996)247 | -Count | Services: | 145 | -Count | |||||||
| Sentiment is an index, sector readings are net balance diffusion measures | |||||||||||
by Robert Brusca January 30, 2009
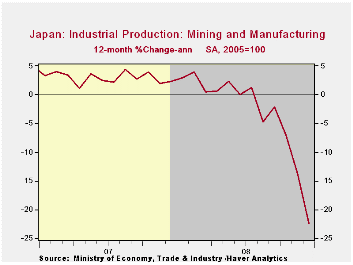
The drop off in Japan’s industrial production index is now
extraordinary as it has posted a month-to-month drop of nearly double
digits. Over three months Japan’s IP is plunging at a 58% annual rate.
It is also down by 22.5% Yr/Yr. Transportation output dropped by 14% in
November and its three-month annualized growth rate is -79%.
Intermediate goods are taking the most sever beating in December. But
consumer goods output is off by 7.9% in December. Investment goods
output is dropping by 4.8% in December. There is no safe haven.
Japan has been sliding for some time. But the figures from
overnight are shocking with household spending off and housing stars
off and construction orders plunging. Unemployment has jumped and
Japan’s manufacturing PMI has dropped for eleven straight months and to
a record low.
Germany, another export dependent country, heard its deputy
finance minister today warn that the hammer blow to exports was
continuing and the domestic economy was getting hit even harder as a
result. The lesson is to be wary of export oriented economies since the
export market is drying up fast, however you define it.
| Japan Industrial Production Trends | ||||||||
|---|---|---|---|---|---|---|---|---|
| m/m % | Saar % | Yr/Yr | Qtr-2-Date | |||||
| seas adjusted | Dec-08 | Nov-08 | Oct-08 | 3-mo | 6-mo | 12-mo | Yr-Ago | % AR |
| mining&MFG | -9.6% | -8.5% | -3.1% | -58.8% | -37.4% | -22.5% | 2.3% | -39.8% |
| Total Industry | -9.2% | -7.9% | -3.4% | -57.4% | -36.2% | -21.7% | 2.3% | -39.2% |
| MFG | -9.6% | -8.5% | -3.2% | -59.0% | -37.5% | -22.5% | 2.4% | -39.8% |
| Textiles | -4.4% | -1.5% | -0.2% | -22.3% | -18.7% | -15.7% | -4.3% | -12.7% |
| T-port | -14.3% | -14.3% | -7.4% | -78.6% | -55.3% | -33.9% | 5.2% | -59.7% |
| Product Group | ||||||||
| Consumer Gds | -7.9% | -6.2% | -2.2% | -49.1% | -28.6% | -16.8% | 2.4% | -33.9% |
| Intermediate Gds | -12.5% | -8.6% | -4.7% | -66.4% | -44.0% | -26.7% | 4.8% | -45.5% |
| Investment Gds | -4.8% | -9.3% | -2.6% | -50.2% | -31.4% | -19.4% | -2.5% | -31.6% |
| Miining | -1.4% | 7.6% | -7.5% | -7.5% | -1.5% | -3.9% | 4.3% | -20.9% |
| Electric&Gas | -3.8% | 0.4% | 1.4% | -8.3% | -3.5% | -4.5% | 2.4% | -3.4% |

Tom Moeller
AuthorMore in Author Profile »Prior to joining Haver Analytics in 2000, Mr. Moeller worked as the Economist at Chancellor Capital Management from 1985 to 1999. There, he developed comprehensive economic forecasts and interpreted economic data for equity and fixed income portfolio managers. Also at Chancellor, Mr. Moeller worked as an equity analyst and was responsible for researching and rating companies in the economically sensitive automobile and housing industries for investment in Chancellor’s equity portfolio. Prior to joining Chancellor, Mr. Moeller was an Economist at Citibank from 1979 to 1984. He also analyzed pricing behavior in the metals industry for the Council on Wage and Price Stability in Washington, D.C. In 1999, Mr. Moeller received the award for most accurate forecast from the Forecasters' Club of New York. From 1990 to 1992 he was President of the New York Association for Business Economists. Mr. Moeller earned an M.B.A. in Finance from Fordham University, where he graduated in 1987. He holds a Bachelor of Arts in Economics from George Washington University.
More Economy in Brief