 Global| Feb 26 2008
U.S. PPI Total & Core Strong
by:Tom Moeller
|in:Economy in Brief
Summary
Finished producer prices surged 1.0% during January following a 0.3% dip in December. The latest increase was triple Consensus expectations for a 0.3% rise. At an annual rate the PPI is up 13.5% during the last three months. Less food [...]
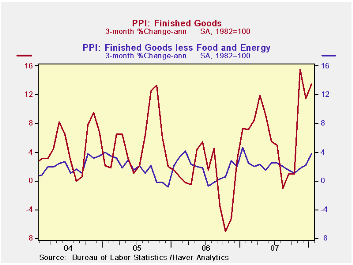
Finished producer prices surged 1.0% during January following a 0.3% dip in December. The latest increase was triple Consensus expectations for a 0.3% rise. At an annual rate the PPI is up 13.5% during the last three months.
Less food and energy this measure of core prices rose 0.4% and it was double expectations. At an annual rate core producer prices have risen 3.7% during the last three months.
Energy prices made up half of December's decline with a 1.5%
rise (+23.7% y/y). Gasoline prices rose 2.9% (48.1% y/y) after a 7.6%
December drop. Home heating oil prices surged 8.5% (48.% y/y) and
natural gas prices rose 0.7% (0.6% y/y) after five consecutive months
of decline.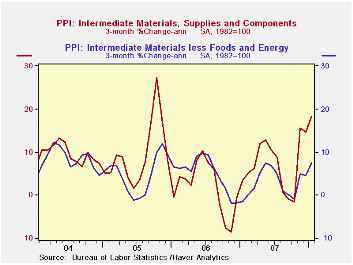
Why Do Gasoline Prices React to Things That Have Not Happened? from the Federal Reserve Bank of St. Louis is available here.
Finished consumer food prices jumped 1.7% (8.2% y/y) after an upwardly revised 1.4% December surge. During the past three months food prices have risen at a 12.0% annual rate.
Prices of core finished consumer goods rose 0.4% (2.7% y/y)
lifted by a 0.8% rise (-0.5% y/y) in passenger car prices and a 0.4%
(1.6%) gain in prices of household appliances. Core consumer
nondurables prices were strong again and rose 0.4% (3.9% y/y). The
three month gain in these prices is 3.9%. Pharmaceutical prices have
been quite strong but apparel prices have been flat. 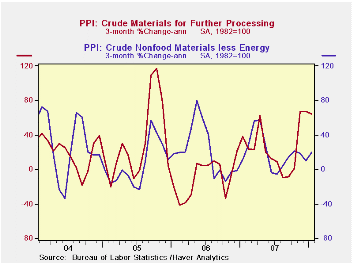
Capital equipment prices also rose 0.4% (1.6% y/y) after a 0.1% December uptick. Heavy truck prices rose 0.4% (3.3% Y/Y) but prices for light trucks fell 0.2% (+0.2% y/y), down for the second consecutive month.
Intermediate goods prices surged 1.4% after a modest 0.2% December decline. Excluding food & energy prices also were strong. They posted a 0.8% increase led by strength in industrial chemical prices which have risen 40.7% (AR) over the last three months. Steel mill prices also have been strong but copper prices have been down.
The crude materials PPI surged 2.5%, more than double the strong December rise. Crude energy materials prices jumped 1.8% (40.9% y/y). The core crude materials PPI surged 4.0% (21.0% y/y) as prices for iron & steel scrap as well as prices for aluminum scrap have been quite strong.
| Producer Price Index | January | December | Y/Y | 2007 | 2006 | 2005 |
|---|---|---|---|---|---|---|
| Finished Goods | 1.0% | -0.3% | 7.7% | 3.9% | 3.0% | 4.9% |
| Core | 0.4% | 0.2% | 2.4% | 1.9% | 1.5% | 2.4% |
| Intermediate Goods | 1.4% | -0.2% | 9.1% | 4.1% | 6.4% | 8.0% |
| Core | 0.8% | 0.0% | 4.1% | 2.8% | 6.0% | 5.5% |
| Crude Goods | 2.5% | 1.1% | 31.0% | 12.2% | 1.4% | 14.6% |
| Core | 4.0% | 0.2% | 21.0% | 15.9% | 20.8% | 4.9% |
by Tom Moeller February 26, 2008
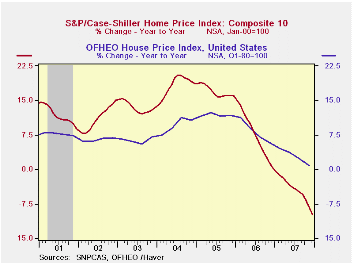
According to the S&P/Case-Shiller Composite 20 home price index, U.S. home prices fell 2.1% m/m in December and repeated the prior months' decline. Home prices have fallen in every month since July of 2006 and the total decline over that period amounts to 10.5%. Prices were down 9.1% y/y.
The index of 20 U.S. cities and their surrounding areas is not adjusted for the quality or the size of the home. The home price index from the Office of Federal Housing Enterprise Oversight (OFHEO) does make these adjustments. This series indicates that through the third quarter home prices still were rising, but at a reduced 1.8% y/y rate.
The composite index of homes in 10 metropolitan areas fell 2.3% (-9.8% y/y) last month.
Home prices in San Diego California continued quite weak and fell 15.0% y/y. Prices in Miami Florida also are down a sharp 17.5% y/y. Home prices in Las Vegas Nevada also were on the list of very weak home prices and fell 15.3% y/y while in Los Angeles prices fell 13.7% y/y.
Relatively moderate declines were registered in New York (-5.6% y/y), Chicago (-4.5% y/y) and Denver, also down 4.5% y/y.
An overview of the S&P/Case-Shiller home price series can be found here.
The S&P/Case-Shiller home price series can be found in Haver's REGIONAL database.
Bubble, Bubble, Toil, and Trouble is a 2007 article from the Federal Reserve Bank of Chicago and it can be found here.
| S&P/Case-Shiller Home Price Index (NSA, Jan 00 = 100) | December | November | Y/Y | 2006 | 2005 | 2004 |
|---|---|---|---|---|---|---|
| 20 City Composite Index | 184.86 | 188.92 | -9.1% | -3.9% | 7.6% | 15.8% |
by Tom Moeller February 26, 2008
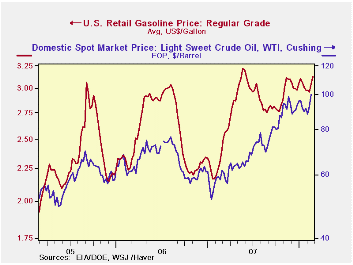
Week to week, retail gasoline prices rose nearly a dime per gallon to $3.13 per gallon, according to the US Department of Energy survey. The retail price for regular grade gasoline was its highest since early last June. This week, a rise in wholesale gasoline prices portend further gains in the retail price.
The price for a barrel of WTI crude oil broke just over $100. This week crude prices have backed off but just slightly to $99.41 per barrel.
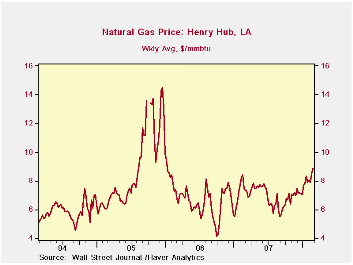
Natural gas prices were strong last week. They rose nearly $1.00 per mmbtu from the January average due to colder Winter temperatures.
| Weekly Prices | 02/25/08 | 02/18/08 | Y/Y | 2007 | 2006 | 2005 |
|---|---|---|---|---|---|---|
| Retail Gasoline ($ per Gallon) | 3.13 | 3.04 | 31.3% | 2.80 | 2.57 | 2.27 |
| Light Sweet Crude Oil, WTI ($ per bbl.) | -- | 100.01 | 72.2% | 94.00 | 61.11 | 58.16 |
by Tom Moeller February 26, 2008
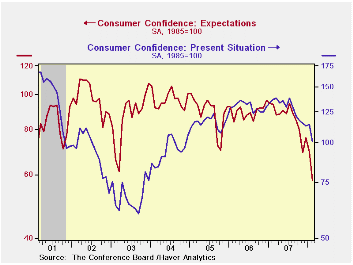
 The Conference Board reported today that consumer confidence
plummeted this month. The 14.1% m/m decline to a reading of 75.0 was
the largest m/m give back since September of 2005 and it dropped the
level to its lowest since early 2003. A consensus of economists foresaw
less of a decline to a level of 82.
The Conference Board reported today that consumer confidence
plummeted this month. The 14.1% m/m decline to a reading of 75.0 was
the largest m/m give back since September of 2005 and it dropped the
level to its lowest since early 2003. A consensus of economists foresaw
less of a decline to a level of 82.
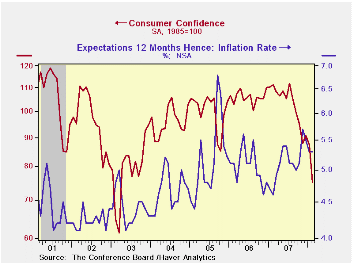
A decline in the expectations component accounted for much of last month's decline in overall confidence. The 16.5% m/m drop followed an 8.6% January decline and lowered the expectations component to its lowest since early 1991. Expectations for business conditions dropped to a 36 year low while expectations for employment dropped to the lowest since 1980.
Respondents planning to buy an automobile within the next six months plummeted but plans to buy an appliance rose.
The present conditions index fell a somewhat lesser 12.0% m/m to the lowest level since late 2004. Just 18.5% of respondents saw business conditions as good, near the least since 2004. Jobs as plentiful were seen by 18.6% while 23.8% saw them as hard to get.
The expected inflation rate in twelve months was stable m/m at 5.3% but that still was up from the 5.1% expected rate during 2006 and 2007.
| Conference Board (SA, 1985=100) | February | January | Y/Y | 2007 | 2006 | 2005 |
|---|---|---|---|---|---|---|
| Consumer Confidence Index | 75.0 | 87.3 | -32.6% | 103.4 | 105.9 | 100.3 |
| Present Conditions | 100.6 | 114.3 | -26.6% | 128.8 | 130.2 | 116.1 |
| Expectations | -- | -- | -- | -- | -- | -- |
by Tom Moeller February 26, 2008
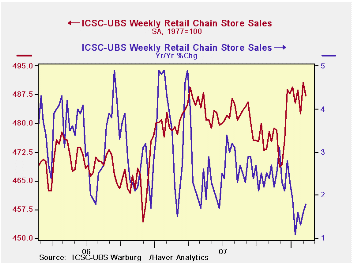
According to the International Council of Shopping Centers ICSC-UBS Chain store survey, chain store sales rose 0.5% last week after no change during the prior period. Sales so far this month are up 0.5% from January after a 1.3% gain during that period.
During the last ten years there has been a 45% correlation between the y/y change in chain store sales and the change in nonauto retail sales less gasoline.The ICSC-UBS retail chain-store sales index is constructed using the same-store sales (stores open for one year) reported by 78 stores of seven retailers: Dayton Hudson, Federated, Kmart, May, J.C. Penney, Sears and Wal-Mart.
The leading indicator of chain store sales from ICSC-UBS fell 0.7% two weeks ago. It as the fifth decline in the last six weeks.
Retail gasoline prices recently moved further off the high reached last Spring of over $3.20 per gallon, according to the US Department of Energy survey.Last week the average retail price for regular grade gasoline fell to $2.96, down 8.0% from last year's peak in May. Prices did, however, remain up nearly 6% from an average of $2.80 last year.
The recent decline in gasoline prices owes mostly to the topping and decline in the price of crude oil. For spot WTI crude oil prices last week of $88.42 per barrel were down 10% from last year's high which nearly touched $100 per barrel.
| ICSC-UBS (SA, 1977=100) | 02/23/08 | 02/16/08 | Y/Y | 2007 | 2006 | 2005 |
|---|---|---|---|---|---|---|
| Total Weekly Chain Store Sales | 489.9 | 487.4 | 2.3% | 2.8% | 3.3% | 3.6% |
| Weekly Prices | 02/25/08 | 02/18/08 | Y/Y | 2007 | 2006 | 2005 |
|---|---|---|---|---|---|---|
| Retail Gasoline ($ per Gallon) | 3.13 | 3.04 | 31.3% | 2.80 | 2.57 | 2.27 |
| Light Sweet Crude Oil, WTI ($ per bbl.) | -- | 100.01 | 72.2% | 94.00 | 61.11 | 58.16 |

Tom Moeller
AuthorMore in Author Profile »Prior to joining Haver Analytics in 2000, Mr. Moeller worked as the Economist at Chancellor Capital Management from 1985 to 1999. There, he developed comprehensive economic forecasts and interpreted economic data for equity and fixed income portfolio managers. Also at Chancellor, Mr. Moeller worked as an equity analyst and was responsible for researching and rating companies in the economically sensitive automobile and housing industries for investment in Chancellor’s equity portfolio. Prior to joining Chancellor, Mr. Moeller was an Economist at Citibank from 1979 to 1984. He also analyzed pricing behavior in the metals industry for the Council on Wage and Price Stability in Washington, D.C. In 1999, Mr. Moeller received the award for most accurate forecast from the Forecasters' Club of New York. From 1990 to 1992 he was President of the New York Association for Business Economists. Mr. Moeller earned an M.B.A. in Finance from Fordham University, where he graduated in 1987. He holds a Bachelor of Arts in Economics from George Washington University.
More Economy in Brief


