 Global| Mar 26 2004
U.S. Personal Spending Growth Slowed
by:Tom Moeller
|in:Economy in Brief
Summary
Consumer spending rose just 0.2% in February following an upwardly revised 0.5% January increase. A 0.5% gain in total PCE had been the Consensus expectation. Despite a modest increase in light vehicle sales last month, durable goods [...]
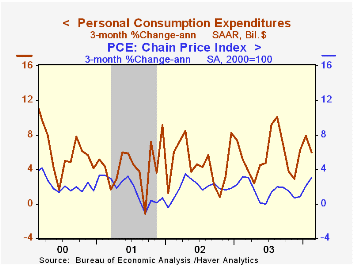
Consumer spending rose just 0.2% in February following an upwardly revised 0.5% January increase. A 0.5% gain in total PCE had been the Consensus expectation.
Despite a modest increase in light vehicle sales last month, durable goods spending fell 0.2%. Spending on non-durables rose a slight 0.1% (6.5% y/y). After accounting for a 0.4% rise in the price deflator for non-durables, real non-durables spending fell 0.4% (+5.0% y/y). Services spending rose 0.4% (5.3% y/y).
Personal income rose 0.4% (+4.6% y/y) in February versus Consensus expectations for a 0.3% gain.
Wages & salaries were strong with a 0.5% (+3.6% y/y) rise after an upwardly revised 0.7% January pop. Strength in wages was again spread evenly across industries.
Personal disposable income rose 0.4% (5.6% y/y) following an upwardly revised 0.9% January jump. Tax payments rose slightly (-3.6% y/y) after the 4.8% January skid.
The PCE chain price index rose 0.2%. Less food & energy prices rose 0.1% (1.1% y/y) last month after a like gain in January, but earlier figures were revised up slightly.
The savings rate ticked up to 1.9%.
| Disposition of Personal Income | Feb | Jan | Y/Y | 2003 | 2002 | 2001 |
|---|---|---|---|---|---|---|
| Personal Income | 0.4% | 0.3% | 4.6% | 3.3% | 2.3% | 3.4% |
| Personal Consumption | 0.2% | 0.5% | 5.8% | 5.0% | 4.8% | 4.5% |
| Savings Rate | 1.9% | 1.8% | 2.0% | 2.1% | 2.3% | 1.7% |
| PCE Chain Price Index | 0.2% | 0.3% | 1.5% | 1.8% | 1.4% | 2.0% |
by Carol Stone March 26, 2004
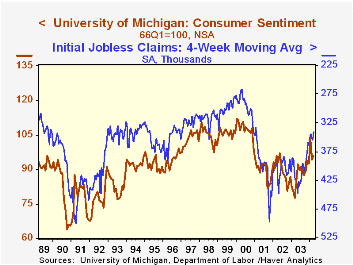
The University of Michigan’s consumer sentiment index rebounded unexpectedly in the latter part of March to give a 95.8 reading for the month as a whole. The mid- month index was 94.1, and Consensus expectations had called for further erosion to 93.2. Instead, the late March results put the month at the best level since mid-2002, apart from the unusual and unsustainable spurt in January.
The gain in sentiment may be related to the reduced number of claims for unemployment insurance. That recently favorable trend is probably the most positive sign about the labor market in many months. A comparison of the Michigan Index with monthly claims data shows 71%-83% correlation over various parts of the last 25 years. So if there are fewer layoffs, people "feel better" enough to push up the Michigan results. In turn, over the last ten years there has been a 76% correlation between the level of consumer sentiment and the y/y change in real PCE. That correlation has risen to 84% during the last five years. While it might go without saying that better labor market conditions should lead to more spending, what we have in the latest jobless claims data and the Michigan Survey is a very early indication that labor markets are getting better and that people may be noticing that. Moreover, the higher sentiment readings are somewhat surprising in light of the sharp nationwide surge in gasoline prices, the recent lackluster stock market, and the renewed terrorist concerns.
Perceptions of both current economic conditions and expectations shared in the more positive economic picture. The assessment of current conditions improved by more than a point from the mid-month result, and expectations reversed their earlier decline to show a net gain for the month, albeit a small one.
The University of Michigan survey is not seasonally adjusted.It is based on telephone interviews with 250 households nationwide on personal finances and business and buying conditions. The survey is expanded to a total of 500 interviews at month end.
| University of Michigan | March | Mid- March | Feb | March 2003 | 2003 | 2002 | 2001 |
|---|---|---|---|---|---|---|---|
| Consumer Sentiment | 95.8 | 94.1 | 94.4 | 77.6 | 87.6 | 89.6 | 89.2 |
| Current Conditions | 106.8 | 105.7 | 103.6 | 90.0 | 97.2 | 97.5 | 100.1 |
| Consumer Expectations | 88.8 | 86.6 | 88.5 | 69.6 | 81.4 | 84.6 | 82.3 |

Tom Moeller
AuthorMore in Author Profile »Prior to joining Haver Analytics in 2000, Mr. Moeller worked as the Economist at Chancellor Capital Management from 1985 to 1999. There, he developed comprehensive economic forecasts and interpreted economic data for equity and fixed income portfolio managers. Also at Chancellor, Mr. Moeller worked as an equity analyst and was responsible for researching and rating companies in the economically sensitive automobile and housing industries for investment in Chancellor’s equity portfolio. Prior to joining Chancellor, Mr. Moeller was an Economist at Citibank from 1979 to 1984. He also analyzed pricing behavior in the metals industry for the Council on Wage and Price Stability in Washington, D.C. In 1999, Mr. Moeller received the award for most accurate forecast from the Forecasters' Club of New York. From 1990 to 1992 he was President of the New York Association for Business Economists. Mr. Moeller earned an M.B.A. in Finance from Fordham University, where he graduated in 1987. He holds a Bachelor of Arts in Economics from George Washington University.
More Economy in Brief


