 Global| Aug 28 2009
U.S. Personal Income Steadies in July after June Drop; PCE Shows First Effect of "Cash-for-Clunkers"
Summary
Personal income in July was almost exactly equalto June's amount, $11,957.4 billion versus $11,953.6 billion. While transfer payments and dividends decreased, this report includes the first increase in wages and salaries since last [...]
Personal income in July was almost exactly equalto June's amount, $11,957.4 billion versus $11,953.6 billion. While transfer payments and dividends decreased, this report includes the first increase in wages and salaries since last October, surely a welcome development, albeit a small one. Consensus forecasts were close to the actual, as they called for a 0.1% rise in total income.Transfers continued to fall in the wake of the stimulus-generated bulge in May, but the July decline was just 0.2%. Notably, this included a small decrease in unemployment benefits. The drop in dividends was 2.6%, larger than in May and June, but much less than the 4.9% average cut each month of Q1.
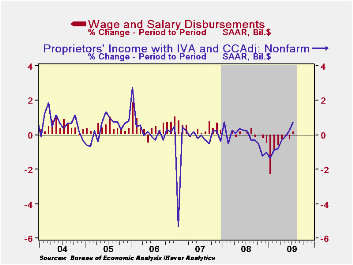
The wage and salary increases were small, just 0.1%, but this
was evenly spread across goods producers, service producers and
government workers. Another cyclically tied item, nonfarm proprietors'
income, gained for a second month, rising in July by 0.8% after 0.3% in
June. Prior to that, this small-business-owners' income had fallen for
10 consecutive months. 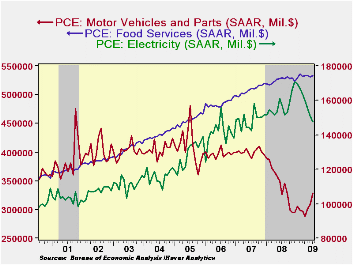
Taxes turned back higher as well last month, increasing 0.8%, their first increase since August 2008. Obviously, the pattern of stimulus-oriented refunds is impacting the monthly changes. More generally, taxes have recently been running at 9% of personal income, compared with 12.6% back at the peak of the economy and the first few months of recession in early 2008.
The steadier behavior of pre-tax incomes means that, despite
the higher taxes in July, disposable personal income
basically held at its June amount after a slightly revised 1.1% decline
in June. Adjusted for inflation, real disposable income eased just
0.1%; it had fallen 1.6% in June. The saving rate decreased again, from
June's 4.5% to 4.2%; obviously lower than the recent peak of 6.0% in
May, it remains far higher than last July's 2.6% and compares favorably
with almost the entire stretch of this decade so far.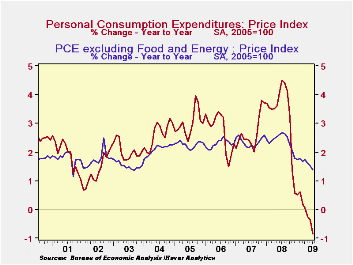
Consumer spending gained 0.2% in July after a 0.6% rise in June. Durable goods outlays were up 1.3%, as the initial weeks of the "cash-for-clunkers" program generated a surge of 22.3% in spending on new autos. [What will August's number show??]. Trucks benefited little from the program, but spending for them still went up 4.8%. Nondurable goods spending eased 0.3%, including a 2.2% drop in gasoline; recreation items, personal care products and household supplies also saw moderate decreases. Among services, total outlays increased 0.3%. This modest change masks some interesting moves individual items: spending on electricity was down 2% and has fallen in every month of 2009 so far. Transportation services were up 1.6%, but those related to personal motor vehicles increased just 0.3% while public transportation outlays gained 5.6%, with ground and air transport both participating. Finally, the comprehensive national accounts revisions have moved restaurants from nondurable goods to the service sector. Food services spending was up 0.4% in July, reversing June's 0.3% decline; the portion spent on "alcohol in purchased meals" gained 0.9%, however, its first increase in five months.
Pricing power remains basically nonexistent. The PCE chain price index was virtually flat last month, as energy prices decreased 0.4% after their surge in June. The ex-food-and-energy "core" was up a mere 0.1%, very close to its May and June amounts. Prices for services, long the most inflation-prone consumer items, increased just 0.1%, but this was largest one-month increase since last October.
The personal income & consumption figures are available in Haver's USECON and USNA databases.
| Disposition of Personal Income (%) | July | June | May | Y/Y | 2008 | 2007 |
|---|---|---|---|---|---|---|
| Personal Income | 0.0 | -1.1 | 1.4 | -2.4 | 2.9 | 5.6 |
| Disposable Personal Income | 0.0 | -1.1 | 1.7 | -0.3 | 3.9 | 4.9 |
| Personal Consumption Expenditures | 0.2 | 0.6 | 0.1 | -1.6 | 3.1 | 5.4 |
| Saving Rate | 4.2 | 4.5 | 6.0 | 2.6 (July '08) | 2.6 | 1.7 |
| PCE Chain Price Index | 0.0 | 0.5 | 0.1 | -0.8 | 3.3 | 2.7 |
| Less food & energy | 0.1 | 0.2 | 0.1 | 1.4 | 2.4 | 2.4 |
by Robert Brusca August 28, 2009
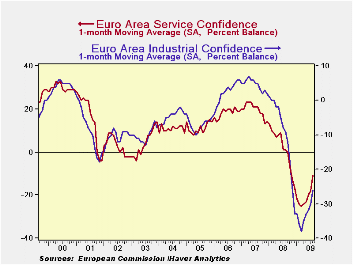
The EU Commission indices kicked out the jams this month with
increases that left the economic forecasts standing in the dust
wondering what happened. The overall commission sentiment index made
its largest jump since at least 1988l lead by the industrial index’s
largest jump since 1988 and the service sector’s largest jump since it
began in 1996. While consumer confidence and retailing improved
month-to-month their respective rises were milder ranking as the 31st
best rise (out of 251 that is still not bad). The EMU overall index
made its second largest jump, The German sentiment index made its
largest jump along with the UK. The monthly rises for Italy and Spain
ranked about 20th in their respective histories. France did not report.
In terms of levels all sectors have a ways to go as sector
readings are negative in absolute terms.
In terms of the various indices standing in their respective
ranges compared to historic vales the EU index stands in the 36th
percentile of its range just above the boundary for the lower third of
its range. The EMU index Germany and Spain all stand around the 30th
percentiles of their respective ranges. The UK is better off in the
40th percentile of its range.
In terms of sectors, the relatively strongest sector is
retailing in the 41st percentile of its range followed by the consumer
confidence reading (35th percentile) and services (31st percentile).
The industrial sector stands in the 28th percentile of its range and
construction hovers in the bottom 13th percentile of its range.
For the most part these distinctions are not so important. All
the various indices stand well below the 50 percentile mark that
denotes the middle of their respective ranges. All are well below par.
All are well away from their respective range midpoints. If this were a
game of football none would have an insurmountable lead but the
construction sector (team) might consider resting its best players to
use another day…The good news this month is in how much the various
indices have risen and improved not about what strikingly high values
they have reached. These readings are still quite weak across sectors
and across EU and EMU reporting countries. The momentum, however, is
excellent.
| EU Sectors and Country level Overall Sentiment | |||||||||||||
|---|---|---|---|---|---|---|---|---|---|---|---|---|---|
| EU | Aug 09 |
Jul 09 |
Jun 09 |
May 09 |
%tile | Rank | Max | Min | Range | Mean | By
Queue Rank% |
R-SQ w/Overall |
Rank
of Change |
| Overall Index | 80.9 | 75 | 71.1 | 67.9 | 36.9 | 229 | 116 | 60 | 56 | 100 | -48.7% | 1.00 | 1 |
| Industrial | -26 | -30 | -33 | -34 | 28.3 | 236 | 7 | -39 | 46 | -7 | -53.2% | 0.90 | 1 |
| Consumer Confidence | -20 | -21 | -23 | -26 | 35.3 | 220 | 2 | -32 | 34 | -11 | -42.9% | 0.86 | 31 |
| Retail | -12 | -14 | -17 | -17 | 41.9 | 216 | 6 | -25 | 31 | -6 | -40.3% | 0.66 | 31 |
| Construction | -36 | -37 | -37 | -39 | 13.0 | 227 | 4 | -42 | 46 | -16 | -47.4% | 0.47 | 44 |
| Services | -11 | -19 | -23 | -26 | 31.7 | 145 | 32 | -31 | 63 | 14 | 5.8% | 0.89 | 1 |
| % m/m | Aug 09 |
Based on Level | Level | ||||||||||
| EMU | 6.1% | 3.8% | 4.3% | 80.6 | 30.5 | 230 | 117 | 65 | 53 | 100 | -49.4% | 0.95 | 2 |
| Germany | 6.3% | 4.1% | 4.3% | 85.9 | 28.0 | 218 | 121 | 72 | 49 | 100 | -41.6% | 0.70 | 1 |
| France | #N/A | 0.5% | 4.4% | #N/A | #N/A | #N/A | #N/A | #N/A | #N/A | #N/A | #N/A | #N/A | #N/A |
| Italy | 4.5% | 4.4% | 1.4% | 87.5 | 37.0 | 222 | 122 | 67 | 55 | 100 | -44.2% | 0.83 | 20 |
| Spain | 3.7% | 5.2% | 2.0% | 81.9 | 30.5 | 223 | 117 | 67 | 50 | 100 | -44.8% | 0.74 | 19 |
| Memo: UK | 13.1% | 7.3% | 4.1% | 83.5 | 40.3 | 226 | 124 | 56 | 68 | 100 | -46.8% | 0.59 | 1 |
| Since Oct 1988 | 251 | -Count | Services: | 154 | -Count | ||||||||
| Sentiment is an index, sector readings are net balance diffusion measures | |||||||||||||
Carol Stone, CBE
AuthorMore in Author Profile »Carol Stone, CBE came to Haver Analytics in 2003 following more than 35 years as a financial market economist at major Wall Street financial institutions, most especially Merrill Lynch and Nomura Securities. She had broad experience in analysis and forecasting of flow-of-funds accounts, the federal budget and Federal Reserve operations. At Nomura Securities, among other duties, she developed various indicator forecasting tools and edited a daily global publication produced in London and New York for readers in Tokyo. At Haver Analytics, Carol was a member of the Research Department, aiding database managers with research and documentation efforts, as well as posting commentary on select economic reports. In addition, she conducted Ways-of-the-World, a blog on economic issues for an Episcopal-Church-affiliated website, The Geranium Farm. During her career, Carol served as an officer of the Money Marketeers and the Downtown Economists Club. She had a PhD from NYU's Stern School of Business. She lived in Brooklyn, New York, and had a weekend home on Long Island.
More Economy in Brief


