 Global| Oct 30 2020
U.S. Personal Income and Spending Stronger than Expected in September
by:Sandy Batten
|in:Economy in Brief
Summary
• Gains in income from private sector offset decreased unemployment insurance payments. • Spending continued to strengthen, still led by spending on goods. • Price inflation edged up but remained well below Fed's target. Personal [...]
• Gains in income from private sector offset decreased unemployment insurance payments.
• Spending continued to strengthen, still led by spending on goods.
• Price inflation edged up but remained well below Fed's target.
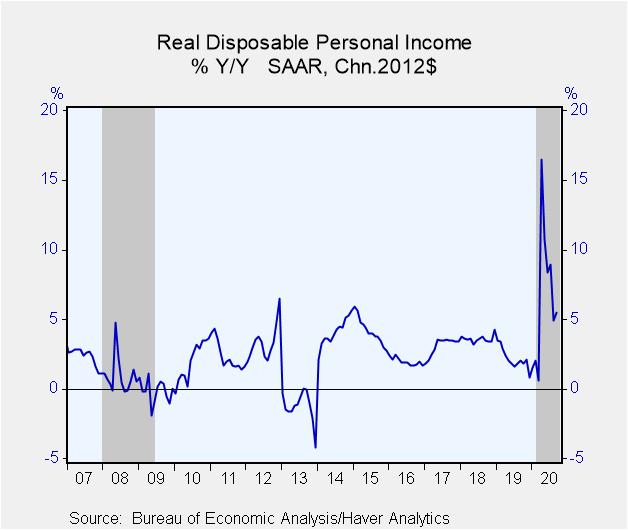
Personal income rebounded in September, rising 0.9% m/m (6.2% y/y) following a 2.5% m/m decline in August (revised from -2.7%). Government payments for unemployment compensation fell further (the Federal government unemployment compensation add-on in the CARES Act expired in August and has not been renewed). The Action Economics Forecast Survey had expected a more modest 0.4% m/m gain in personal income. Employee compensation rose 0.8% m/m (+0.5% y/y, the first y/y increase since March). Proprietors' income jumped up 5.1% m/m; rental income rose 1.0% m/m while income from assets slipped 0.1% m/m. Personal transfer receipts edged down 0.1% m/m, mostly reflecting a second very large decline in unemployment insurance payments (-42.2% m/m in September after -52.1% m/m in August). Disposable personal income also rose 0.9% m/m (6.9% y/y) in September following a 2.9% m/m decline in August. Adjusted for inflation, real disposable income increased 0.7% m/m (+5.5% y/y) in September.
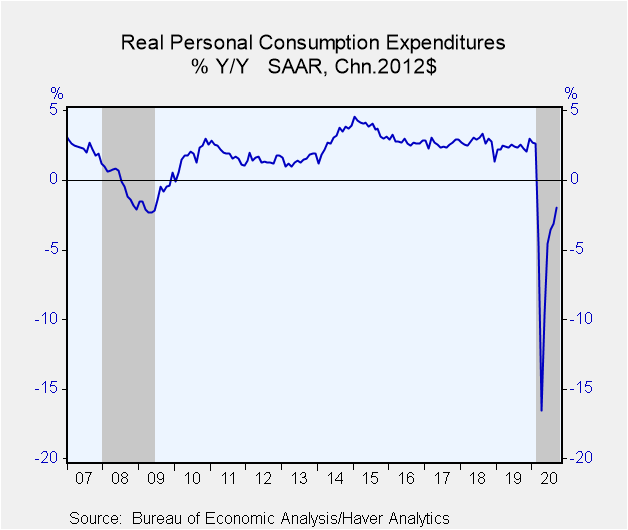
Personal consumption expenditures increased 1.4% m/m last month (-0.6% y/y) following an unrevised 1.0% m/m gain in August. This was the fifth consecutive monthly increase after the catastrophic declines in March and April. A 1.0% m/m rise had been expected. Adjusted for inflation, real spending increased a solid 1.2% m/m (-2.0% y/y) in September versus 0.7% m/m in August. The strong end to Q3 provides a good starting point for Q4 as real spending in September was 4.3% annualized above the Q3 average. The rise in spending continued to be led by spending on goods. Real spending on goods increased 2.2% m/m in September with spending on durable goods increasing 2.9% m/m and spending on nondurables rising 1.7% m/m. While real spending on services posted its fifth consecutive monthly increase, it was up only 0.8% m/m. Compared with pre-COVID peaks, spending on goods is 7.6% higher while spending on services is 7.3% lower. Clearly, spending on services, notably eating out, accommodation and travel, is still being adversely impacted by the pandemic.
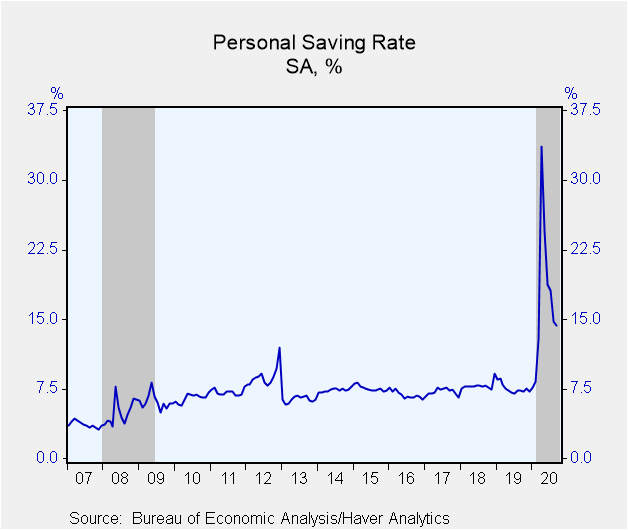
Last month's rise in spending relative to income lowered the personal saving rate to 14.3% from an upwardly revised 14.8% in August. The rate reached a record high 33.6% in April. The level of personal saving fell 2.6% m/m (+108.4% y/y) in September.
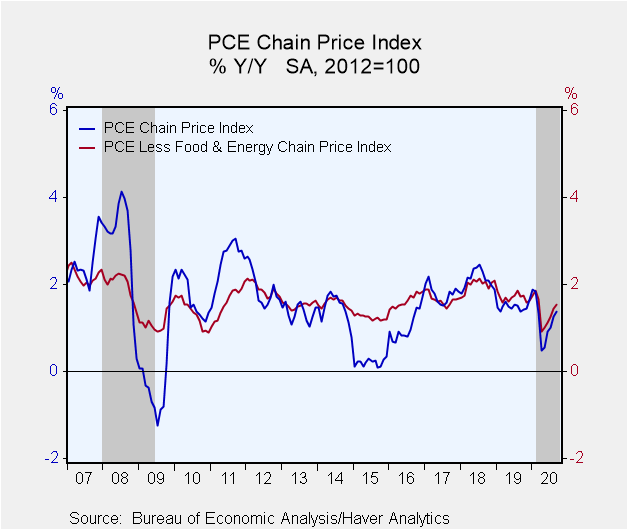
The PCE chain price index increased 0.2% (1.4% y/y) in September following an unrevised 0.3% m/m rise in August. The price index excluding food and energy also rose 0.2% (1.5% y/y) after an unrevised 0.3% increase in August. Energy prices increased 0.7% (-8.1% y/y), the fourth consecutive monthly gain. Food prices eased 0.3% (+3.9% y/y).
The personal income and consumption figures are available in Haver's USECON database with detail in the USNA database. The Action Economics figures are in the AS1REPNA database.
Sandy Batten
AuthorMore in Author Profile »Sandy Batten has more than 30 years of experience analyzing industrial economies and financial markets and a wide range of experience across the financial services sector, government, and academia. Before joining Haver Analytics, Sandy was a Vice President and Senior Economist at Citibank; Senior Credit Market Analyst at CDC Investment Management, Managing Director at Bear Stearns, and Executive Director at JPMorgan. In 2008, Sandy was named the most accurate US forecaster by the National Association for Business Economics. He is a member of the New York Forecasters Club, NABE, and the American Economic Association. Prior to his time in the financial services sector, Sandy was a Research Officer at the Federal Reserve Bank of St. Louis, Senior Staff Economist on the President’s Council of Economic Advisors, Deputy Assistant Secretary for Economic Policy at the US Treasury, and Economist at the International Monetary Fund. Sandy has taught economics at St. Louis University, Denison University, and Muskingun College. He has published numerous peer-reviewed articles in a wide range of academic publications. He has a B.A. in economics from the University of Richmond and a M.A. and Ph.D. in economics from The Ohio State University.
More Economy in Brief
 Global| Feb 05 2026
Charts of the Week: Balanced Policy, Resilient Data and AI Narratives
by:Andrew Cates


