 Global| Apr 01 2009
U.S. Pending Home Sales Tick Higher
by:Tom Moeller
|in:Economy in Brief
Summary
The National Association of Realtors indicated that pending sales of existing homes during February edged up 2.1% after the sharp 7.7% decline during January. The decline left sales so far this year 6.4% below the 2008 average after [...]
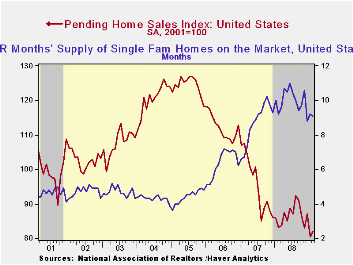
The National Association of Realtors indicated that pending sales of existing homes during February edged up 2.1% after the sharp 7.7% decline during January. The decline left sales so far this year 6.4% below the 2008 average after last year's 9.5% decline. Consensus expectations had been for a 0.5% February slip.
The home sales figures are analogous to the new home sales data from the Commerce Department in that they measure existing home sales when the sales contract is signed, not at the time the sale is closed. The series dates back to 2001.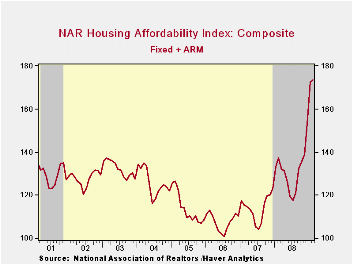
Lower prices continued to bolster home sales. The median sales price of an existing home rose in February (-15.5% y/y) after seven straight months of decline. Prices were down by one quarter from their peak during June 2007. Lower prices combined with lower interest rates to significantly raise the affordability index of a home by 26.5% year-to-year and by three quarters from the 2006 low. The latest level was a record high for the series which extends back to 1970.
Weak home sales are encouraging potential sellers to keep their homes off the market. The Realtors Association indicated in an earlier report that the number of homes on the market and available for sale fell by 5.5% during February versus one year earlier.
At the current sales rate there was a 9.7 months' supply of homes on the market and there was a 10.4 months' supply during all of last year, up from the 8.9 months supply during 2007 and 6.5 months during 2006. For single family homes, there was a 9.1 months' supply in February versus a full-year figure of 10.0 months during 2008.
The pending home sales data are available in Haver's PREALTOR database. The number of homes on the market and prices are in the REALTOR database.
| Pending Home Sales (2001=100) | February | January | Y/Y | 2008 | 2007 | 2006 |
|---|---|---|---|---|---|---|
| Total | 82.1 | 80.4 | -1.4% | 86.8 | 95.8 | 112.1 |
| Northeast | 63.9 | 57.8 | -11.3 | 72.6 | 85.6 | 98.5 |
| Midwest | 83.1 | 72.6 | 3.4 | 80.6 | 89.5 | 102.0 |
| South | 85.8 | 82.2 | -0.1 | 89.8 | 107.3 | 127.3 |
| West | 89.6 | 103.6 | -1.8 | 99.3 | 92.1 | 109.5 |

Tom Moeller
AuthorMore in Author Profile »Prior to joining Haver Analytics in 2000, Mr. Moeller worked as the Economist at Chancellor Capital Management from 1985 to 1999. There, he developed comprehensive economic forecasts and interpreted economic data for equity and fixed income portfolio managers. Also at Chancellor, Mr. Moeller worked as an equity analyst and was responsible for researching and rating companies in the economically sensitive automobile and housing industries for investment in Chancellor’s equity portfolio. Prior to joining Chancellor, Mr. Moeller was an Economist at Citibank from 1979 to 1984. He also analyzed pricing behavior in the metals industry for the Council on Wage and Price Stability in Washington, D.C. In 1999, Mr. Moeller received the award for most accurate forecast from the Forecasters' Club of New York. From 1990 to 1992 he was President of the New York Association for Business Economists. Mr. Moeller earned an M.B.A. in Finance from Fordham University, where he graduated in 1987. He holds a Bachelor of Arts in Economics from George Washington University.
More Economy in Brief


