 Global| Apr 09 2008
U.S. Pending Home Sales Fell As Expected in February
by:Tom Moeller
|in:Economy in Brief
Summary
For February, the National Association of Realtors reported that the level of pending sales of existing homes fell 1.9% after having been roughly unchanged in January. The latest reading was as expected and it was down 11.6% from the [...]
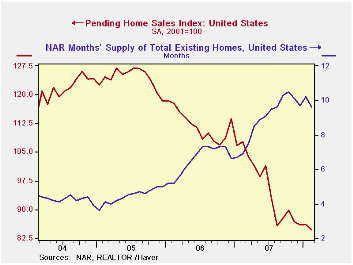
For February, the National Association of Realtors reported that the level of pending sales of existing homes fell 1.9% after having been roughly unchanged in January. The latest reading was as expected and it was down 11.6% from the average sales level in 2007.
These figures are analogous to the new home sales data from the Commerce Department in that they measure existing home sales when the sales contract is signed, not at the time the sale is closed.
On a running basis three month basis, the rate of decline in home sales eased somewhat to -10.2% (AR) from the worst rate of decline of over 40% last summer.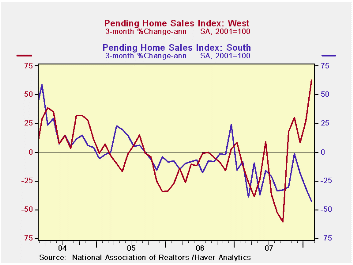
Sales in the West actually have risen 20.7% from their low last August and the three month rate of change through February soared to 62.9%.
That improvement, however, was countered by a sharp deterioration in sales in the South where the three month change in sales fell to a negative 42.7%.
Despite a 3.7% decline in February sales in the Midwest, on a three month basis sales have stabilized and show a slight increase. In the Northeast sales rose 3.2% last month but the three month change remained quite negative at -11.4%.
The Realtors also indicated in an earlier report that the number of homes on the market and available for sale fell 3.0% (+6.0% y/y) in February. At the current sales rate there were 9.6 months of homes on the market versus an 8.9 months average during all of last year.
The pending home sales data are available in Haver's PREALTOR database and the number of homes on the market are in the REALTOR database.
Energy and the Economy from the Federal Reserve Bank of St. Louis is available here.
| Pending Home Sales (2001=100) | February | January | Y/Y | 2007 | 2006 | 2005 |
|---|---|---|---|---|---|---|
| Total | 84.6 | 86.2 | -21.4% | 95.7 | 112.1 | 124.3 |
| Northeast | 71.8 | 69.6 | -25.4 | 85.6 | 98.5 | 108.3 |
| Midwest | 82.7 | 85.9 | -17.4 | 89.6 | 102.0 | 116.4 |
| South | 85.0 | 89.9 | -30.3 | 107.3 | 127.3 | 134.8 |
| West | 95.8 | 93.8 | -6.2 | 92.3 | 109.5 | 128.6 |

Tom Moeller
AuthorMore in Author Profile »Prior to joining Haver Analytics in 2000, Mr. Moeller worked as the Economist at Chancellor Capital Management from 1985 to 1999. There, he developed comprehensive economic forecasts and interpreted economic data for equity and fixed income portfolio managers. Also at Chancellor, Mr. Moeller worked as an equity analyst and was responsible for researching and rating companies in the economically sensitive automobile and housing industries for investment in Chancellor’s equity portfolio. Prior to joining Chancellor, Mr. Moeller was an Economist at Citibank from 1979 to 1984. He also analyzed pricing behavior in the metals industry for the Council on Wage and Price Stability in Washington, D.C. In 1999, Mr. Moeller received the award for most accurate forecast from the Forecasters' Club of New York. From 1990 to 1992 he was President of the New York Association for Business Economists. Mr. Moeller earned an M.B.A. in Finance from Fordham University, where he graduated in 1987. He holds a Bachelor of Arts in Economics from George Washington University.
More Economy in Brief


