 Global| Nov 26 2008
U.S. PCE Fell 1.0% During October; Income Rose 0.3%
by:Tom Moeller
|in:Economy in Brief
Summary
Led by a 5.9% m/m drop in consumer spending on motor vehicles (-17.8% y/y), personal consumption expenditures fell 1.0% last month. It was the third consecutive monthly decline and was the largest for any month since the recession of [...]
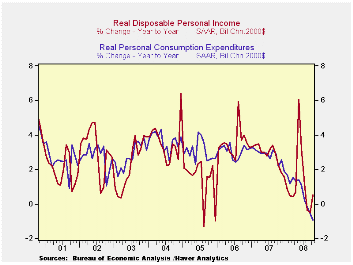
Led by a 5.9% m/m drop in consumer spending on motor vehicles (-17.8% y/y), personal consumption expenditures fell 1.0% last month. It was the third consecutive monthly decline and was the largest for any month since the recession of 1991. In fact, it was one of the largest declines in the series' history.
Spending began the fourth quarter 1.3% below 3Q. Real spending fell in October for the third consecutive month. The 0.5% decline (-0.9% y/y) left the starting point for spending 0.8% below the 3Q average and the three month rate of growth at a negative 4.0%. Real spending on motor vehicles fell at a 23.5% annual rate during the last three months. Furniture spending fell at a 10.9% rate following an 8.0% gain last year. Spending on clothing fell at a 14.6% rate during the last three months after a 4.7% rise during 2007.
Disposable personal income increased 0.4% last month following a downwardly revised 0.1% September uptick. The absence of tax rebate checks and weaker job gains have slowed y/y growth to 3.8% after last year's rise of 5.5% and of 6.4% during 2006. Adjusted for inflation disposable income rose 0.5% y/y after a 2.8% rise during all of last year.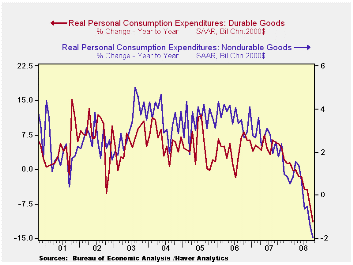
Overall, personal income rose 0.3% last month which was slightly better than expectations. But wage & salary income ticked up just 0.1% after the 0.1% slip during September. The y/y gain of 2.3% compares to a 5.6% rise last year. Factory sector wages fell for the third straight month (-0.6% y/y) and wages & salaries in the private service-providing industries barely increased 0.1%. Their 2.2% y/y rise is roughly one-third of last year's increase. Wages in the government sector rose 0.4% (5.2% y/y).
The PCE chain price index fell 0.6% and the index returned to its June level. Lower gasoline prices, off 13.5% (+12.5% y/y) again offset the rise in food prices which rose 0.4% (6.2% y/y). The core PCE price index fell slightly and it was the first decline since 2001. The decline matched Consensus expectations. Three-month growth of 1.4% was the lowest since late-2006. Furniture prices fell yet again (-3.7% y/y) while apparel prices fell 1.1% (-0.1% y/y). Transportation costs rose 6.0% y/y while medical care prices rose 1.9%.
The personal savings rate rose sharply to 2.4%, it's highest since June, as spending fell and income rose.
The figures noted above are available in the Haver USECON and in the USNA databases.
| Disposition of Personal Income (%) | October | September | Y/Y | 2007 | 2006 | 2005 |
|---|---|---|---|---|---|---|
| Personal Income | 0.3 | 0.1 | 3.3 | 6.1 | 7.1 | 5.6 |
| Disposable Personal Income | 0.4 | 0.1 | 3.8 | 5.5 | 6.4 | 4.4 |
| Personal Consumption | -1.0 | -0.3 | 2.3 | 5.5 | 5.9 | 6.2 |
| Saving Rate | 2.4 | 1.0 | 0.7 (Oct. '07) | 0.5 | 0.7 | 0.3 |
| PCE Chain Price Index | -0.6 | 0.1 | 3.2 | 2.6 | 2.8 | 2.9 |
| Less food & energy | -0.0 | 0.2 | 2.1 | 2.2 | 2.3 | 2.1 |
by Tom Moeller November 26, 2008
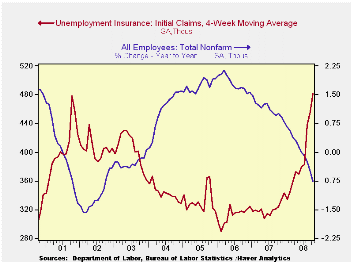
The rise in initial claims for jobless insurance took a breather last week. The 14,000 decline to 529,000 was the first material weekly fall in over one month. Yet despite the decline, initial claims for the month remained 10.7% higher than they were in October.
Expectations had been for claims last week of 533,000. The four-week moving average of initial claims rose to this cycle's high of 518,500 (54.2% y/y).
The largest increases in initial claims for the week ending Nov. 15 were in Illinois (+5,285), Michigan (+2,697), Wisconsin (+1,551), Indiana (+1,549), and Missouri (+1,487), while the largest decreases were in California (-9,436), Tennessee (-4,566), North Carolina (-4,512), New Jersey (-3,729), and Florida (-2,686).
Continuing claims for unemployment insurance during the week of November 8 fell 54,000 and that reversed about half of the prior week's increase. The four-week average of continuing claims nevertheless rose to 3,929,000, this cycle's high and the highest since 1982. Continuing claims provide some indication of workers' ability to find employment and they lag the initial claims figures by one week.
The insured rate of unemployment remained at this cycle's high of 3.0%. The Commerce Department indicated that the highest insured unemployment rates in the week ending Nov. 8 were in Puerto Rico (5.0 percent), Oregon (4.2), Michigan (3.8), Nevada (3.8), South Carolina (3.6), New Jersey (3.5), Pennsylvania (3.5), Alaska (3.4), Arkansas (3.4), and California (3.4).
Sectoral Reallocation and Unemployment from the Federal Reserve Bank of San Francisco is available here.
| Unemployment Insurance (000s) | 11/22/08 | 11/15/08 | 11/08/08 | Y/Y | 2007 | 2006 | 2005 |
|---|---|---|---|---|---|---|---|
| Initial Claims | 529 | 543 | 516 | 51.6% | 322 | 313 | 331 |
| Continuing Claims | -- | 3,962 | 4,016 | 49.0% | 2,552 | 2,459 | 2,662 |
by Tom Moeller November 26, 2008
The U.S. Census Department reported that October sales of new single-family homes fell 5.3% m/m to 433,000 after a downwardly revised 0.7% September uptick. The level of sales in October was off by nearly 70% from the July 2005 peak and sales fell short of Consensus expectations for 443,000.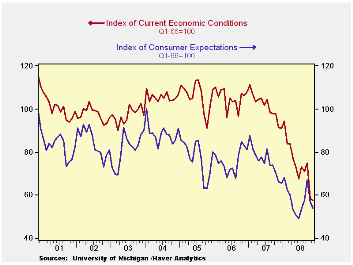
The m/m change in sales was quite mixed by region. Sales in the West dropped 18.0% and sales in the South were off 6.0%. These declines were countered by gains elsewhere in the country. New home sales in the Midwest sales recovered half of their September decline with a 6.0% gain and new home sales in the Northeast rose 22.6% to their highest level since June.
The median price for a new single-family home declined 1.7% to $218,000. The drop came after a 0.4% September gain that was better than the initial report of a m/m decline. Prices were off 7.0% y/y and new home prices in September were back to where they were late in 2004. The decline in home prices matched the 7.0% drop for September reported yesterday by the Office of Federal Housing Enterprise Oversight (FHFA). The FHFA figures, (formerly the Office of Federal Housing Enterprise Oversight (OFHEO), as well as the Census Dept. figures, are available in Haver's USECON database.
The number of new homes for purchase again fell again fell sharply, by 8.0% (-25.7% y/y). That reduced the inventory of unsold homes to the lowest level since mid-2004. In each of the country's regions, the inventory is down roughly one-quarter during the last year.
The month's supply of new homes for sale ticked higher m/m to 11.1 and that roughly has been the level since earlier this year.
| US New Homes | October | September | Y/Y (%) | 2007 | 2006 | 2005 |
|---|---|---|---|---|---|---|
| Total Sales (SAAR, 000s) | 433 | 457 | -40.1 | 768 | 1,049 | 1,279 |
| Northeast | 38 | 31 | -41.5 | 64 | 64 | 81 |
| Midwest | 71 | 67 | -44.5 | 118 | 161 | 203 |
| South | 233 | 248 | -38.5 | 408 | 559 | 638 |
| West | 91 | 111 | -39.7 | 178 | 266 | 356 |
| Median Price (NSA, $) | 218,000 | 221,700 | -7.0 | 243,742 | 243,067 | 234,208 |
by Tom Moeller November 26, 2008
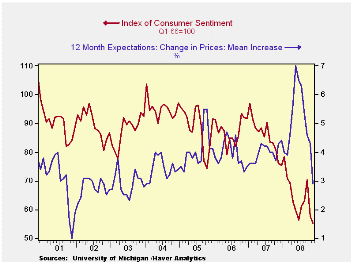
The University of Michigan's reading of consumer sentiment for the full month of November was worse than at mid-month. The full month index fell to 55.3 from the mid-month read of 57.9 and from 57.6 for October. The latest level was the lowest since early-1980 and it was lower than Consensus expectations for a reading of 57.7.
During the last ten years there has been a 55% correlation between the level of sentiment and the three-month change in real consumer spending.
The view of current personal finances fell to a record low level, off by nearly one half from last year's average. Sixty one percent of respondents indicated their finances were worse off than last year, a record high. The index of buying conditions for large household goods fell sharply to the lowest since 1980. Most (54%) indicated that now was a bad time to buy because of a heightened sense that times were bad and that more bad times lay ahead.
The expectations component of consumer sentiment was down further than reported at mid-month. A 5.3% m/m November decline came on top of the 15.2% October drop. The figures were, however, slightly above the lows reached this past Spring. Expectations for business conditions during the next years fell to their lowest since July and expectations for conditions during the next year fell as well. The expected change in personal finances improved slightly.
The opinion of government policy, which apparently influences economic expectations, remained about unchanged from October (-37.8% y/y). Only a slightly improved six percent of respondents thought that a good job was being done by government while 55% thought a poor job was being done. That was near the highest percentage on record.
Recent economic weakness and lower oil prices caused inflation expectations to fall. The mean expected rate of inflation during the next year plummeted to 2.9% from 4.3% last month. It was as high as 7.0% in May. The expected inflation rate during the next five years was stable at 3.1%, near the lowest level since 2003.
The University of Michigan survey is not seasonally adjusted.The reading is based on telephone interviews with about 500 households at month-end; the mid-month results are based on about 300 interviews. The summary indexes are in Haver's USECON database, with details in the proprietary UMSCA database.
| University of Michigan | November | Mid-November | October | September | November y/y | 2007 | 2006 | 2005 |
|---|---|---|---|---|---|---|---|---|
| Consumer Sentiment | 55.3 | 57.9 | 57.6 | 70.3 | -27.3% | 85.6 | 87.3 | 88.5 |
| Current Conditions | 57.5 | 61.4 | 58.4 | 75.0 | -37.2 | 101.2 | 105.1 | 105.9 |
| Expectations | 53.9 | 55.7 | 57.0 | 67.2 | -18.6 | 75.6 | 75.9 | 77.4 |

Tom Moeller
AuthorMore in Author Profile »Prior to joining Haver Analytics in 2000, Mr. Moeller worked as the Economist at Chancellor Capital Management from 1985 to 1999. There, he developed comprehensive economic forecasts and interpreted economic data for equity and fixed income portfolio managers. Also at Chancellor, Mr. Moeller worked as an equity analyst and was responsible for researching and rating companies in the economically sensitive automobile and housing industries for investment in Chancellor’s equity portfolio. Prior to joining Chancellor, Mr. Moeller was an Economist at Citibank from 1979 to 1984. He also analyzed pricing behavior in the metals industry for the Council on Wage and Price Stability in Washington, D.C. In 1999, Mr. Moeller received the award for most accurate forecast from the Forecasters' Club of New York. From 1990 to 1992 he was President of the New York Association for Business Economists. Mr. Moeller earned an M.B.A. in Finance from Fordham University, where he graduated in 1987. He holds a Bachelor of Arts in Economics from George Washington University.
More Economy in Brief


