 Global| Apr 02 2004
U.S. Non-farm Payrolls Soared
by:Tom Moeller
|in:Economy in Brief
Summary
Non-farm payrolls grew in March the most for any one month since April 2000. The 308,000 jump was triple the Consensus expectation and followed upwardly revised payroll gains in February and January. Service producing payrolls jumped [...]
Non-farm payrolls grew in March the most for any one month since April 2000. The 308,000 jump was triple the Consensus expectation and followed upwardly revised payroll gains in February and January.
Service producing payrolls jumped 230,000 (0.8% y/y). The 0.2% monthly gain was the largest increase since May 2000. It was led by a 73,000 (0.3% y/y) rise in the trade (retail 47,100), transportation & utilities category. These figures were boosted by the return of 10-20,000 striking workers.
Another standout was the professional & business services category where payrolls rose 42,000 (2.2% y/y) but jobs in the temporary help services industry fell slightly (+9.6% y/y).
Government sector jobs jumped 31,000 (-0.2% y/y) and construction jobs surged 71,000 (3.0% y/y) following February's weather-depressed decline.
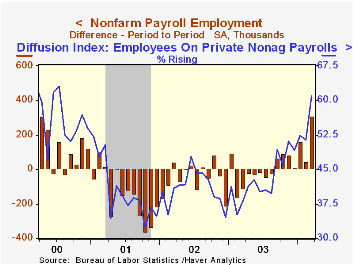
Manufacturing sector payrolls were unchanged, the first month factory sector payrolls did not decline since July 2000. Gains were scattered across several durable goods industries but payrolls in nondurable goods industries were mostly lower. The one-month diffusion index for manufacturing payrolls backpedaled some to 48.8%. Readings near 50 are consistent with roughly no change in payrolls.
The one-month diffusion index for private non-farm payrolls jumped to 61.0%, the highest level since July 2000. This breadth-of-change measure has had an 87% correlation with the monthly change in employment over the last ten years.
The index of aggregate hours worked (employment times hours worked) fell 0.1% following the upwardly revised no change in February. Aggregate hours in 1Q rose 1.5% (AR) versus 4Q when they rose 1.9%.
Average hourly earnings ticked higher by just 0.1% (1.8% y/y), the smallest gain in three months. Earnings in the factory sector were unchanged (2.4% y/y) following a downwardly revised February gain of 0.1%.
From the separate household survey the unemployment rate moved higher to 5.7% versus expectations for no change at 5.6%.
Household employment fell 3,000 (+0.7% y/y), the third decline in four months. The labor force jumped 179,000 (+0.6% y/y). The labor force participation rate was unchanged at 65.9% versus 67.1% averaged from 1997-2000.
An "Explanatory Note" from the Bureau of Labor Statistics defining the separate employment surveys is available here .
"The Outsourcing Bogeyman" from the Council on Foreign Relations can be found here.
| Employment | Mar | Feb | Y/Y | 2003 | 2002 | 2001 |
|---|---|---|---|---|---|---|
| Payroll Employment | 308,000 | 46,000 | 0.5% | -0.3% | -1.1% | 0.0% |
| Manufacturing | 0,000 | -4,000 | -2.8% | -4.8% | -7.2% | -4.8% |
| Average Weekly Hours | 33.7 | 33.8 | 33.8 | 33.7 | 33.8 | 34.0 |
| Average Hourly Earnings | 0.1% | 0.2% | 1.8% | 2.7% | 2.9% | 3.8% |
| Unemployment Rate | 5.7% | 5.6% | 5.8% | 6.0% | 5.8% | 4.8% |
by Tom Moeller April 2, 2004
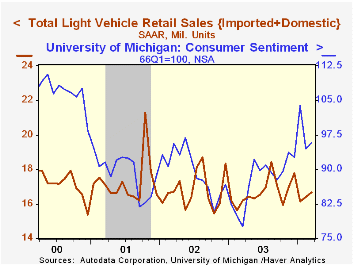
Unit sales of light vehicles rose slightly for the second month in March, up 1.9% to 16.68M following a 1.5% February gain. Consensus expectations were for sales of 16.7M.
Car sales rose 4.1% to 7.72M on the heels of a 5.0% gain in February. Sales of light trucks ticked just 0.1% higher following two successive months of decline.
Domestic light vehicle sales rose 1.4% m/m to 13.32M (+4.5% y/y). Imported vehicle sales (3.36M) added 3.9% in March to the 7.0% February gain (-2.3% y/y).
Imports captured 20.2% of the US market for new vehicles in March versus 19.7% during 2003.
| Light Vehicle Sales (SAAR, Mil.Units) | Mar | Feb | Y/Y | 2003 | 2002 | 2001 |
|---|---|---|---|---|---|---|
| Total | 16.68 | 16.37 | 3.1% | 16.69 | 16.81 | 17.26 |
| Autos | 7.72 | 7.41 | -0.2% | 7.63 | 8.07 | 8.48 |
| Trucks | 8.96 | 8.96 | 6.1% | 9.06 | 8.74 | 8.78 |

Tom Moeller
AuthorMore in Author Profile »Prior to joining Haver Analytics in 2000, Mr. Moeller worked as the Economist at Chancellor Capital Management from 1985 to 1999. There, he developed comprehensive economic forecasts and interpreted economic data for equity and fixed income portfolio managers. Also at Chancellor, Mr. Moeller worked as an equity analyst and was responsible for researching and rating companies in the economically sensitive automobile and housing industries for investment in Chancellor’s equity portfolio. Prior to joining Chancellor, Mr. Moeller was an Economist at Citibank from 1979 to 1984. He also analyzed pricing behavior in the metals industry for the Council on Wage and Price Stability in Washington, D.C. In 1999, Mr. Moeller received the award for most accurate forecast from the Forecasters' Club of New York. From 1990 to 1992 he was President of the New York Association for Business Economists. Mr. Moeller earned an M.B.A. in Finance from Fordham University, where he graduated in 1987. He holds a Bachelor of Arts in Economics from George Washington University.
More Economy in Brief


