 Global| Jan 09 2004
U.S. Non-farm Payrolls Disappoint
by:Tom Moeller
|in:Economy in Brief
Summary
Non-farm payrolls rose a weak 1,000 in December and gains in prior months were revised down.Consensus expectations were for a 150,000 December gain. Next month, the payroll figures will undergo an annual benchmark revision. The index [...]
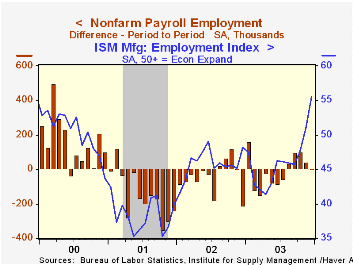
Non-farm payrolls rose a weak 1,000 in December and gains in prior months were revised down.Consensus expectations were for a 150,000 December gain. Next month, the payroll figures will undergo an annual benchmark revision.
The index of aggregate hours worked fell 0.6% but for 4Q rose at a 2.2% annual rate versus 3Q. It was the first quarterly gain in hours worked since 4Q 2000.
From the separate household survey, the unemployment rate fell to 5.7% versus expectations for an unchanged 5.9%. The figures reflect benchmark revision.
Household employment fell 54,000 (+1.5% y/y) following strong gains of 438,000 and 451,000 in the prior two months. The labor force also fell by 309,000 (+1.2% y/y) following strong gains in the prior two months.
Manufacturing sector payrolls fell 26,000 (-3.4% y/y) following a like decline in November that was downwardly revised. The one-month diffusion index for factory payrolls fell to 38.1 from 42.9, and thus continued to suggest lower factory payrolls in the near term. Weakness in factory sector jobs was broad based.
Analysis of employment and sales in the computer industry by the Federal Reserve Bank of Dallas can be found here.
Service producing jobs rose a modest 13,000 (0.3% y/y). Jobs in the retail trade industry fell by 38,000 (-0.5% y/y) and jobs in the financial sector fell for the third consecutive month (+0.8% y/y). Temporary help services jobs were again strong, up 30,000 (7.7% y/y). Education & health services jobs also rose 21,000 (1.8% y/y) but government sector jobs fell for the eighth month of 2003 (-0.4% y/y).
Construction jobs rose 14,000 (2.1% y/y) for the second month.
The one-month diffusion index for private non-farm payrolls fell to 50.4% from 54.3 in November, suggesting minimal employment growth
Average hourly earnings rose 0.2% (2.0% Y/Y). Earnings in the factory sector rose 0.3% (2.3% Y/Y).
| Employment | Dec | Nov | Y/Y | 2003 | 2002 | 2001 |
|---|---|---|---|---|---|---|
| Payroll Employment | 1,000 | 43,000 | -0.1% | -0.2% | -1.1% | 0.0% |
| Manufacturing | -26,000 | -26,000 | -3.4% | -3.9% | -6.9% | -4.8% |
| Average Weekly Hours | 33.7 | 33.9 | 33.8 | 33.7 | 33.9 | 34.0 |
| Average Hourly Earnings | 0.2% | 0.1% | 2.0% | 2.9% | 2.9% | 3.8% |
| Unemployment Rate | 5.7% | 5.9% | 6.0% | 6.0% | 5.8% | 4.8% |

Tom Moeller
AuthorMore in Author Profile »Prior to joining Haver Analytics in 2000, Mr. Moeller worked as the Economist at Chancellor Capital Management from 1985 to 1999. There, he developed comprehensive economic forecasts and interpreted economic data for equity and fixed income portfolio managers. Also at Chancellor, Mr. Moeller worked as an equity analyst and was responsible for researching and rating companies in the economically sensitive automobile and housing industries for investment in Chancellor’s equity portfolio. Prior to joining Chancellor, Mr. Moeller was an Economist at Citibank from 1979 to 1984. He also analyzed pricing behavior in the metals industry for the Council on Wage and Price Stability in Washington, D.C. In 1999, Mr. Moeller received the award for most accurate forecast from the Forecasters' Club of New York. From 1990 to 1992 he was President of the New York Association for Business Economists. Mr. Moeller earned an M.B.A. in Finance from Fordham University, where he graduated in 1987. He holds a Bachelor of Arts in Economics from George Washington University.
More Economy in Brief


