 Global| Sep 25 2008
U.S. New-Home Sales Lowest Since Early-1991
by:Tom Moeller
|in:Economy in Brief
Summary
August sales of new single-family homes dropped 11.5% from July following a little revised 4.0% increase during that month. The latest drop greatly exceeded Consensus expectations. More impressive, however, was that the latest level [...]
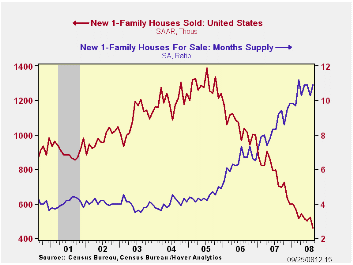
August sales of new single-family homes dropped 11.5% from July following a little revised 4.0% increase during that month. The latest drop greatly exceeded Consensus expectations. More impressive, however, was that the latest level of sales was the lowest since January of 1991 and it undoubtedly reflected the recent turmoil in the credit markets.
By region, sales in the West fell by one-third from their July level and that pulled sales down 50.0% from the year ago total. From their peak level in 2005, sales out West are down 82.1%. New home sales in the Northeast also were notably weak and they posted a 31.9% m/m decline. The level about equaled where sales were in May but that was down 69.2% from the 2004 peak. New home sales in the South fell a lesser 2.1% m/m but they were still down 60.4% from the early-2005 high. In the Midwest sales recovered 7.2% m/m following three months of sharp decline. However, the latest level still was down 71.1% from the 2003 peak.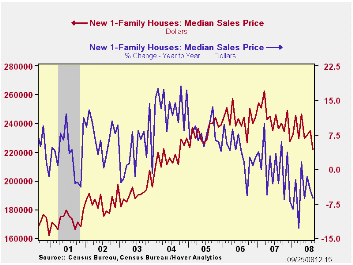
The median price for a new single-family home fell 5.5% m/m to $221,900. The 6.2% y/y decline compares to a peak rate of growth of 13.9% back in 2004.
The number of new homes for sale fell further, by a sharp 4.4% (-23.5% y/y). That reduced the inventory of unsold homes to the lowest level since late-2004. In each of the country's regions the inventory is down just short of one-quarter during the last year.
The month's supply of new homes for sale ticked slightly higher to 10.9 and that was near the record high.
Fed Chairman Ben S. Bernanke's testimony the morning on the Economic Outlook can be found here.
| US New Homes | August | July | Y/Y | 2007 | 2006 | 2005 |
|---|---|---|---|---|---|---|
| Total Sales (SAAR, 000s) | 460 | 520 | -34.5% | 768 | 1,049 | 1,279 |
| Northeast | 32 | 47 | -45.8 | 64 | 64 | 81 |
| Midwest | 74 | 69 | -39.3 | 118 | 161 | 203 |
| South | 276 | 282 | -24.4 | 408 | 559 | 638 |
| West | 78 | 122 | -50.0 | 178 | 266 | 356 |
| Median Price (NSA, $) | 221,900 | 234,900 | -6.2 | 243,742 | 243,067 | 234,208 |

Tom Moeller
AuthorMore in Author Profile »Prior to joining Haver Analytics in 2000, Mr. Moeller worked as the Economist at Chancellor Capital Management from 1985 to 1999. There, he developed comprehensive economic forecasts and interpreted economic data for equity and fixed income portfolio managers. Also at Chancellor, Mr. Moeller worked as an equity analyst and was responsible for researching and rating companies in the economically sensitive automobile and housing industries for investment in Chancellor’s equity portfolio. Prior to joining Chancellor, Mr. Moeller was an Economist at Citibank from 1979 to 1984. He also analyzed pricing behavior in the metals industry for the Council on Wage and Price Stability in Washington, D.C. In 1999, Mr. Moeller received the award for most accurate forecast from the Forecasters' Club of New York. From 1990 to 1992 he was President of the New York Association for Business Economists. Mr. Moeller earned an M.B.A. in Finance from Fordham University, where he graduated in 1987. He holds a Bachelor of Arts in Economics from George Washington University.
More Economy in Brief


