 Global| Feb 26 2013
U.S. New Home Sales Jump As Prices Decline
by:Tom Moeller
|in:Economy in Brief
Summary
During January, sales of new homes jumped 15.6% (28.9% y/y) to 437,000 (AR). That compared to 378,000 sales during December, revised from 369,000. Consensus expectations had been for sales of 380,000. Sales increased throughout the [...]
During January, sales of new homes jumped 15.6% (28.9% y/y) to 437,000 (AR). That compared to 378,000 sales during December, revised from 369,000. Consensus expectations had been for sales of 380,000. Sales increased throughout the country. New home sales in the West were up 60.3% y/y to 125,000 while sales in the Northeast rose 54.2% y/y to 37,000. In the South, sales gained 16.6% y/y to 225,000 last month and sales in the Midwest rose 13.6% y/y to 50,000.
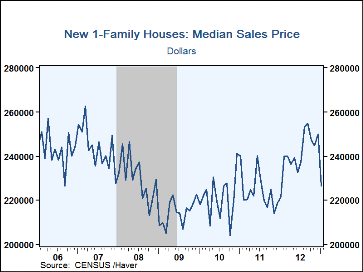
Attractive prices may have bolstered interest in buying a new home last month.The median price of a new home fell 9.4% (+2.1% y/y) to $226,400, the lowest level in twelve months.
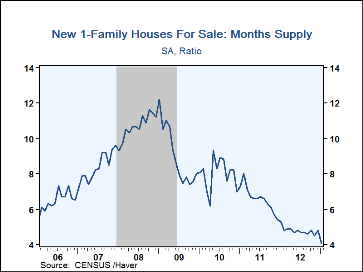
Despite these one month changes, conditions in the new home market remain tight.The inventory of unsold homes remains near the record low while the months supply of new homes fell last month to 4.1, also near the record low. The low level of home inventories stretches across the country. On a one month basis, home inventories were unchanged in January and y/y they nudged up a negligible 0.7%. (The series dates back to 1960.)
The length of time to sell a new home ticked up during January. Nevertheless, it took just 4.7 months to sell a home, down from the 7.1 month average for all of last year. These figures compare to more than 14 months at the beginning of 2010.
The data in this report are available in Haver's USECON database. The consensus expectation figure is from the Action Economics survey and is available in the AS1REPNA database.
Monetary Report to the Congress from the Board of Governors of the Federal Reserve System can be found here.
| U.S. New Home Sales | Jan | Dec | Nov | Y/Y % | 2012 | 2011 | 2010 |
|---|---|---|---|---|---|---|---|
| Total (SAAR, 000s) | 437 | 378 | 393 | 28.9 | 366 | 307 | 321 |
| Northeast | 37 | 29 | 35 | 54.2 | 28 | 21 | 31 |
| Midwest | 50 | 45 | 43 | 13.6 | 49 | 45 | 45 |
| South | 225 | 218 | 223 | 16.6 | 195 | 168 | 173 |
| West | 125 | 86 | 92 | 60.3 | 94 | 72 | 74 |
| Median Price (NSA, $) | 226,400 | 249,800 | 245,600 | 2.1 | 241,033 | 224,317 | 221,242 |
Tom Moeller
AuthorMore in Author Profile »Prior to joining Haver Analytics in 2000, Mr. Moeller worked as the Economist at Chancellor Capital Management from 1985 to 1999. There, he developed comprehensive economic forecasts and interpreted economic data for equity and fixed income portfolio managers. Also at Chancellor, Mr. Moeller worked as an equity analyst and was responsible for researching and rating companies in the economically sensitive automobile and housing industries for investment in Chancellor’s equity portfolio. Prior to joining Chancellor, Mr. Moeller was an Economist at Citibank from 1979 to 1984. He also analyzed pricing behavior in the metals industry for the Council on Wage and Price Stability in Washington, D.C. In 1999, Mr. Moeller received the award for most accurate forecast from the Forecasters' Club of New York. From 1990 to 1992 he was President of the New York Association for Business Economists. Mr. Moeller earned an M.B.A. in Finance from Fordham University, where he graduated in 1987. He holds a Bachelor of Arts in Economics from George Washington University.


