 Global| Dec 23 2019
U.S. New Home Sales Gain in November, but from Revised Lower Levels
Summary
Sales of new single-family homes increased 1.3% m/m (+16.9% y/y) in November to 719,000 units SAAR. However, the November gain comes from levels that were revised sharply lower in both September and October. September sales were [...]
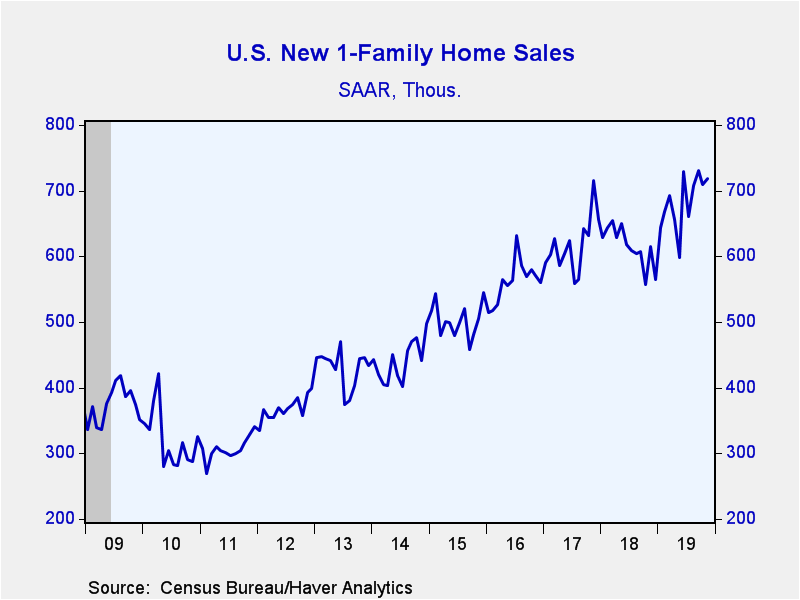
Sales of new single-family homes increased 1.3% m/m (+16.9% y/y) in November to 719,000 units SAAR. However, the November gain comes from levels that were revised sharply lower in both September and October. September sales were revised from 738,000 to 730,000 and October sales were revised from 733,000 to 710,000. The Action Economics survey had expected sales of 735,000 in November. So, even though sales increased in November, the marked downward revisions meant that November sales were well below expectations.
Although interpretation of this month's reading has been influenced by the downward revisions, there is no mistaking the surge in new home sales over the past year.
The median price of a new home rose 4.4% m/m (+7.2% y/y) to $330,800 in November. The median price is still 3.8% below the record high of $343,400 in November 2017. The average price of a new home increased 2.7% m/m (+5.7% y/y) to $388,200.
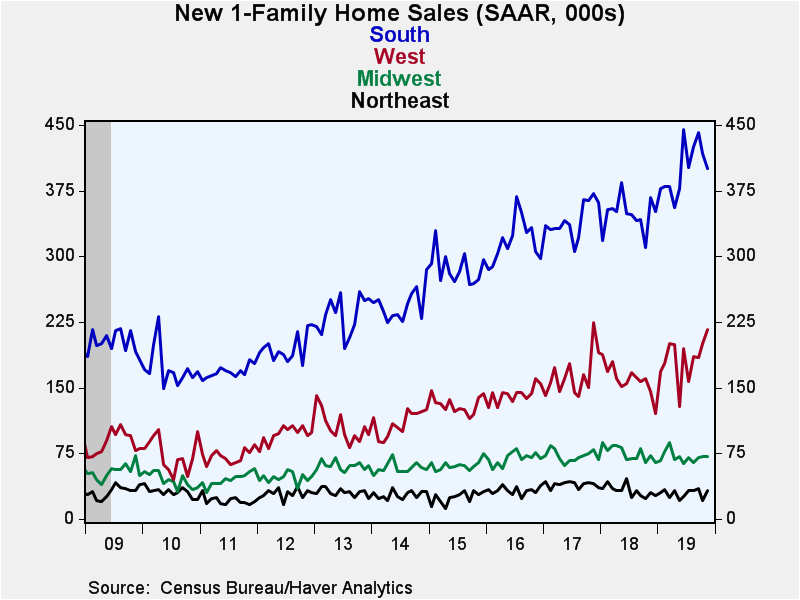
Sales were mixed across the country last month. In November, sales fell in the South, were unchanged in the Midwest and rose significantly in the Northeast and West. Sales in the South fell 4.1% m/m to 400,000 (the second consecutive monthly decline), but were still 14.0% above yearend 2018. Sales in the Northeast nearly reversed October's decline, rising 52.4%. Sales in the West posted a solid 7.5% m/m rise to 216,000, the second consecutive large monthly gain.
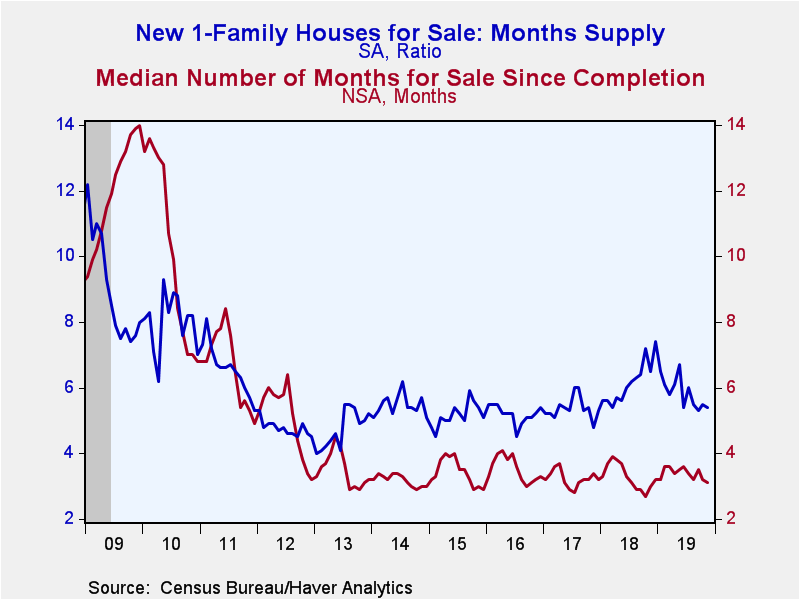
The months' supply of homes on the market edged down to 5.4 months in November from 5.5 months in October, remaining well below the recent high of 7.4 months reached in December 2018. The median number of months a new home was on the market after its completion declined to 3.1 months in November, its lowest in a year.
The data in this report are available in Haver's USECON database. The consensus expectation figure from Action Economics is available in the AS1REPNA database.
| U.S. New Single-Family Home Sales (SAAR, 000s) | Nov | Oct | Sep | Nov Y/Y % | 2018 | 2017 | 2016 |
|---|---|---|---|---|---|---|---|
| Total | 719 | 710 | 730 | 16.9 | 615 | 617 | 562 |
| Northeast | 32 | 21 | 35 | 6.7 | 32 | 40 | 32 |
| Midwest | 71 | 71 | 70 | -1.4 | 75 | 72 | 69 |
| South | 400 | 417 | 441 | 9.0 | 348 | 341 | 318 |
| West | 216 | 201 | 184 | 47.9 | 160 | 164 | 142 |
| Median Price (NSA, $) | 330,800 | 316,900 | 312,100 | 7.2 | 323,125 | 321,633 | 306,500 |
Peter D'Antonio
AuthorMore in Author Profile »Peter started working for Haver Analytics in 2016. He worked for nearly 30 years as an Economist on Wall Street, most recently as the Head of US Economic Forecasting at Citigroup, where he advised the trading and sales businesses in the Capital Markets. He built an extensive Excel system, which he used to forecast all major high-frequency statistics and a longer-term macroeconomic outlook. Peter also advised key clients, including hedge funds, pension funds, asset managers, Fortune 500 corporations, governments, and central banks, on US economic developments and markets. He wrote over 1,000 articles for Citigroup publications. In recent years, Peter shifted his career focus to teaching. He teaches Economics and Business at the Molloy College School of Business in Rockville Centre, NY. He developed Molloy’s Economics Major and Minor and created many of the courses. Peter has written numerous peer-reviewed journal articles that focus on the accuracy and interpretation of economic data. He has also taught at the NYU Stern School of Business. Peter was awarded the New York Forecasters Club Forecast Prize for most accurate economic forecast in 2007, 2018, and 2020. Peter D’Antonio earned his BA in Economics from Princeton University and his MA and PhD from the University of Pennsylvania, where he specialized in Macroeconomics and Finance.
More Economy in Brief
 Global| Feb 05 2026
Charts of the Week: Balanced Policy, Resilient Data and AI Narratives
by:Andrew Cates


