 Global| Nov 28 2018
U.S. New Home Sales and Prices Remain Sluggish
Summary
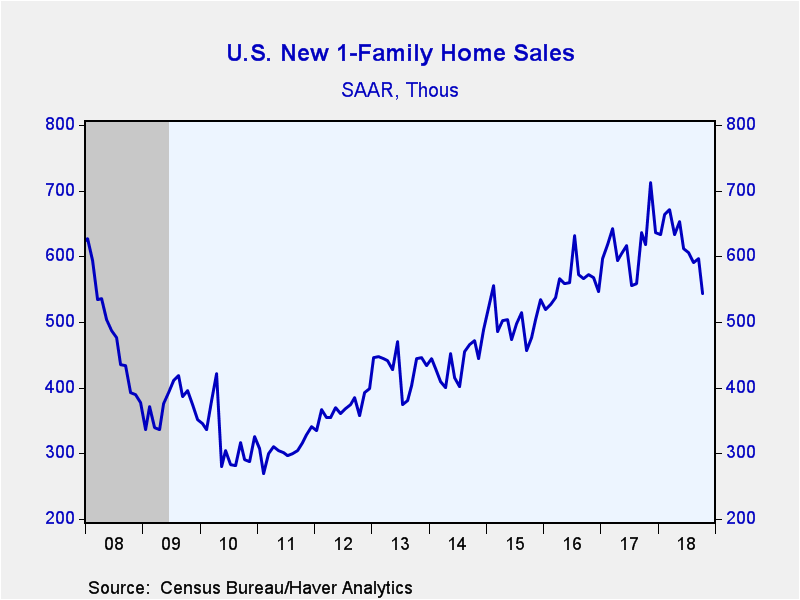
The market for new homes is continuing to weaken. New single-family home sales fell 8.9% (-12.0% y/y) in October to 544,000 (SAAR). It was the fourth decrease in the last five months and carried sales down to their lowest since March [...]
The market for new homes is continuing to weaken. New single-family home sales fell 8.9% (-12.0% y/y) in October to 544,000 (SAAR). It was the fourth decrease in the last five months and carried sales down to their lowest since March 2016. Revisions to previous months' sales were positive, however: those in September, originally reported at 553,000, were revised to 597,000, and those in August, which had been reported last month at 585,000, were revised to 591,000. The October result did undershoot the expectations in the Action Economics Forecast Survey, which had estimated 585,000 sales. These sales transactions are recorded when sales contracts are signed or deposits are made.
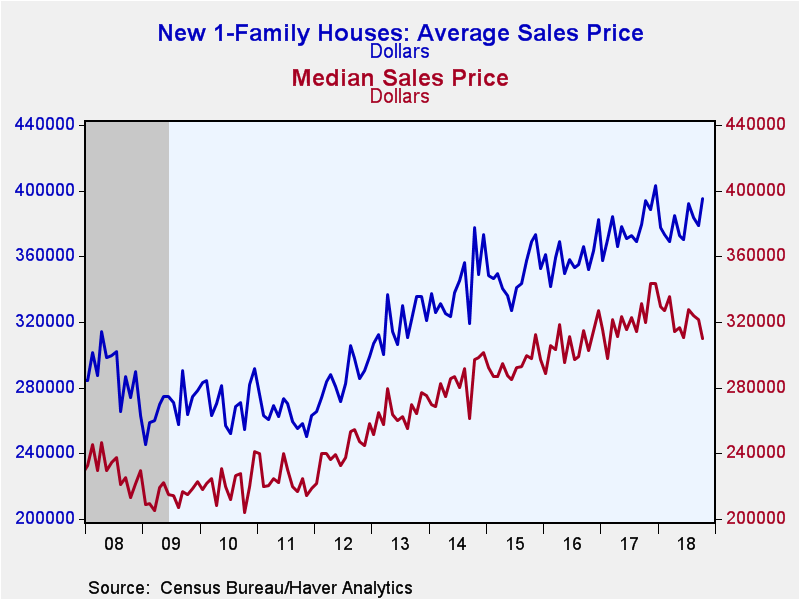
The median price of a new home fell 3.6% (-3.1% y/y) in October to $309,700 from $321,300 in September. The average price of a new home rose, however, to $395,000 (+0.3% y/y) from $379.000 in September.
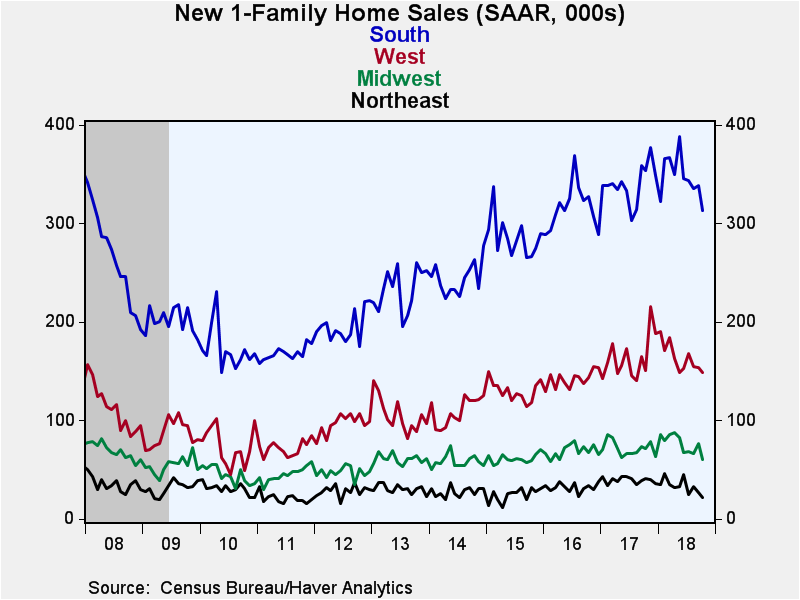
By region, the largest percentage decline last month was in the Midwest, where sales fell 22.1% (-16.7% y/y) to 60,000. Those in the Northeast dropped 18.5% m/m (-46.3% y/y) to 22,000. In the South, sales were off 7.7% in October (-11.6% y/y) to 313,000, while those in the West eased 3.2% (-6.3% y/y) to 149,000.
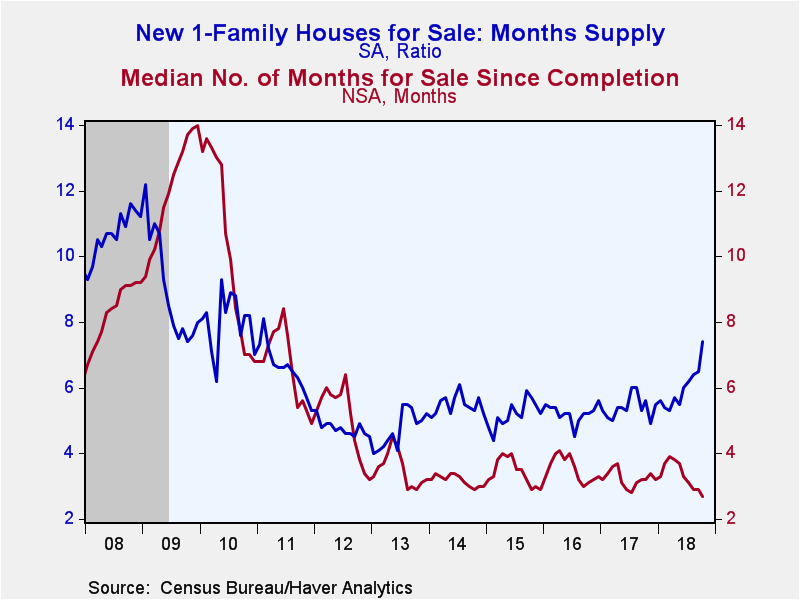
The months' supply of homes on the market increased to 7.4 in October from 6.5 months during September. These figures were up sharply from the recent low of 4.5 months in July 2016. The median number of months a new home was on the market after its completion edged down from 2.9 in September to 2.7 in October; this is the shortest for-sale period in the history of this series, which dates from 1975.
The data in this report are available in Haver's USECON database. The consensus expectation figure from Action Economics is available in the AS1REPNA database.
| U.S. New Single-Family Home Sales (SAAR, 000s) | Oct | Sep | Aug | Oct Y/Y % | 2017 | 2016 | 2015 |
|---|---|---|---|---|---|---|---|
| Total | 544 | 597 | 591 | -12.0 | 616 | 560 | 502 |
| Northeast | 22 | 27 | 33 | -46.3 | 40 | 32 | 25 |
| Midwest | 60 | 77 | 67 | -16.7 | 72 | 69 | 61 |
| South | 313 | 339 | 336 | -11.6 | 341 | 317 | 286 |
| West | 149 | 154 | 155 | -1.3 | 164 | 142 | 130 |
| Median Price (NSA, $) | 309,700 | 321,300 | 323,800 | -3.1 | 321,633 | 306,500 | 293,733 |
Carol Stone, CBE
AuthorMore in Author Profile »Carol Stone, CBE came to Haver Analytics in 2003 following more than 35 years as a financial market economist at major Wall Street financial institutions, most especially Merrill Lynch and Nomura Securities. She had broad experience in analysis and forecasting of flow-of-funds accounts, the federal budget and Federal Reserve operations. At Nomura Securities, among other duties, she developed various indicator forecasting tools and edited a daily global publication produced in London and New York for readers in Tokyo. At Haver Analytics, Carol was a member of the Research Department, aiding database managers with research and documentation efforts, as well as posting commentary on select economic reports. In addition, she conducted Ways-of-the-World, a blog on economic issues for an Episcopal-Church-affiliated website, The Geranium Farm. During her career, Carol served as an officer of the Money Marketeers and the Downtown Economists Club. She had a PhD from NYU's Stern School of Business. She lived in Brooklyn, New York, and had a weekend home on Long Island.
More Economy in Brief
 Global| Feb 05 2026
Charts of the Week: Balanced Policy, Resilient Data and AI Narratives
by:Andrew Cates


