 Global| Mar 03 2004
U.S. Light Vehicle Sales Tread Water
by:Tom Moeller
|in:Economy in Brief
Summary
Unit sales of light vehicles ticked up a slight 1.5% m/m in February to 16.37M following a 9.1% January slump. Consensus expectations were for sales of 16.5M. Car sales recovered 5.0% m/m to 7.41M after two months of decline. Sales of [...]
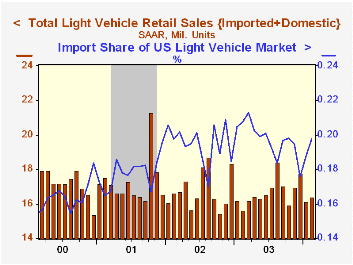
Unit sales of light vehicles ticked up a slight 1.5% m/m in February to 16.37M following a 9.1% January slump. Consensus expectations were for sales of 16.5M.
Car sales recovered 5.0% m/m to 7.41M after two months of decline. Sales of light trucks fell 1.2% following a 10.5% drop in January.
Domestic light vehicle sales rose 0.2% m/m to 13.14M (+6.2% y/y). Imported vehicle sales jumped 7.0% m/m to 3.24M (-0.2% y/y).
Imports captured 19.8% of the US market for new vehicles in February versus 19.7% during 2003.
| Light Vehicle Sales (SAAR, Mil.Units) | Feb | Jan | Y/Y | 2003 | 2002 | 2001 |
|---|---|---|---|---|---|---|
| Total | 16.37 | 16.13 | 4.9% | 16.69 | 16.81 | 17.26 |
| Autos | 7.41 | 7.06 | 0.4% | 7.63 | 8.07 | 8.48 |
| Trucks | 8.96 | 9.07 | 8.9% | 9.06 | 8.74 | 8.78 |
by Tom Moeller March 3, 2004
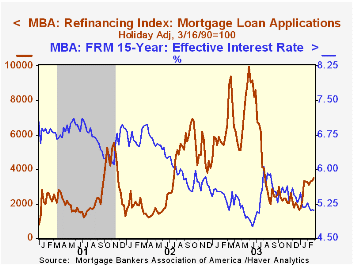
The index of mortgage applications compiled by the Mortgage Bankers Association rose 2.8% last week, the third consecutive weekly gain. Applications rose 6.8% during all of last month versus January.
Applications to refinance jumped another 5.1% w/w as interest rates continued down. Refis for the month were up 20.2% from January and 79.6% from the December low.
Purchase applications slipped 0.2% w/w following two weeks of moderate gain. Purchase applications fell 7.4% in February versus January.
During the last ten years there has been a 54% correlation between the y/y change in purchase applications and the change in new plus existing home sales.
The effective interest rate on a conventional 30-Year mortgage fell to 5.75% from 5.77% the prior week. The effective rate on a 15-year mortgage fell to 5.10%.
The Mortgage Bankers Association surveys between 20 to 35 of the top lenders in the U.S. housing industry to derive its refinance, purchase and market indexes. The weekly survey accounts for more than 40% of all applications processed each week by mortgage lenders. Visit the Mortgage Bankers Association site here.
| MBA Mortgage Applications (3/16/90=100) | 2/27/04 | 2/20/04 | 2003 | 2002 | 2001 |
|---|---|---|---|---|---|
| Total Market Index | 878.7 | 854.5 | 1,067.9 | 799.7 | 625.6 |
| Purchase | 422.6 | 423.5 | 395.1 | 354.7 | 304.9 |
| Refinancing | 3,532.2 | 3,361.9 | 4,981.8 | 3,388.0 | 2,491.0 |
by Tom Moeller March 3, 2004
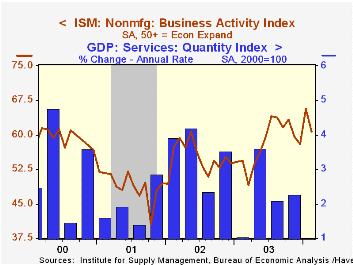
The Business Activity Index for the non-manufacturing sector, reported by the Institute for Supply Management, slipped in February to 60.8 from the record high of 65.7 in January. Consensus expectations had been for a a reading of 64.0.
Since the series' inception in 1997 there has been a 41% correlation between the Business Activity Index and the q/q change in the GDP Service Sector Quantity Index.
New orders fell to 60.3 from the near-record high of 64.9 in January.
The employment index fell for the third month to 52.7. It was the seventh month in eight above 50.
Since the series' inception in 1997 there has been a 62% correlation between the level of the ISM non-manufacturing employment index and the m/m change in payroll employment in the service producing and construction industries.Business activity for the non-manufacturing sector is a question separate from the subgroups mentioned above. In contrast, the NAPM manufacturing sector composite index weights the components.
The seasonally adjusted prices index fell to 57.3 from 59.7 in January.
ISM surveys more than 370 purchasing managers in more than 62 industries including construction, law firms, hospitals, government and retailers. The non-manufacturing survey dates only to July 1997, therefore its seasonal adjustment should be viewed tentatively.
| ISM Non-manufacturing Survey | Feb | Jan | Feb '03 | 2003 | 2002 | 2001 |
|---|---|---|---|---|---|---|
| Business Activity Index | 60.8 | 65.7 | 54.3 | 58.1 | 55.1 | 48.9 |
| Prices Index | 57.3 | 59.7 | 58.9 | 56.7 | 53.9 | 51.5 |

Tom Moeller
AuthorMore in Author Profile »Prior to joining Haver Analytics in 2000, Mr. Moeller worked as the Economist at Chancellor Capital Management from 1985 to 1999. There, he developed comprehensive economic forecasts and interpreted economic data for equity and fixed income portfolio managers. Also at Chancellor, Mr. Moeller worked as an equity analyst and was responsible for researching and rating companies in the economically sensitive automobile and housing industries for investment in Chancellor’s equity portfolio. Prior to joining Chancellor, Mr. Moeller was an Economist at Citibank from 1979 to 1984. He also analyzed pricing behavior in the metals industry for the Council on Wage and Price Stability in Washington, D.C. In 1999, Mr. Moeller received the award for most accurate forecast from the Forecasters' Club of New York. From 1990 to 1992 he was President of the New York Association for Business Economists. Mr. Moeller earned an M.B.A. in Finance from Fordham University, where he graduated in 1987. He holds a Bachelor of Arts in Economics from George Washington University.
More Economy in Brief


